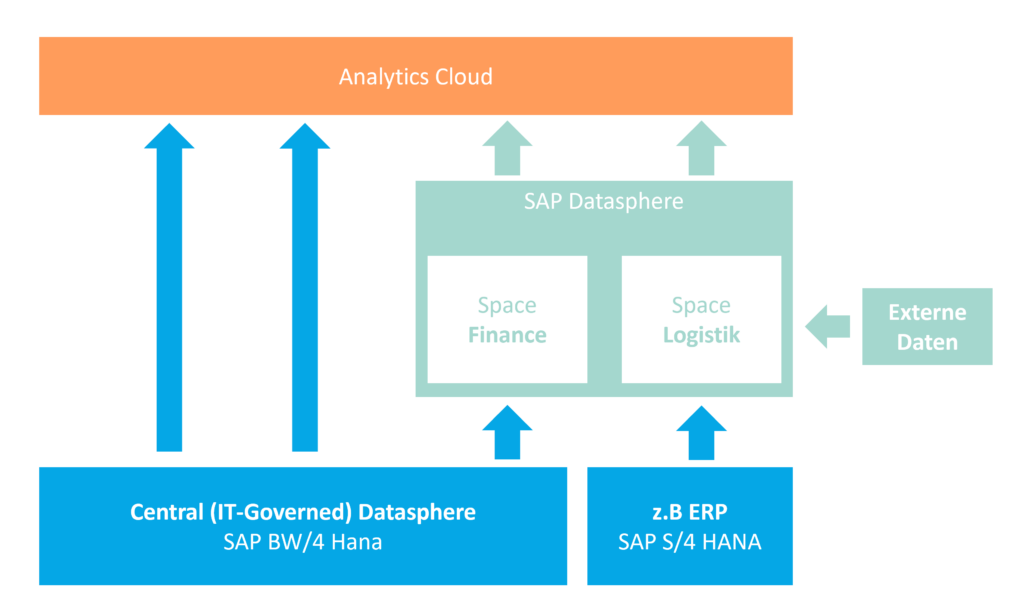
Datasphere is SAP's latest data warehouse product. As a software-as-a-service solution, it is based on the new HANA Cloud Services. In the short or long term, Datasphere should be able to map a full-fledged enterprise data warehouse in addition to a self-service data preparation use case.
SAP is investing heavily in the integration of both solutions. For example, the “Model Transfer Connection”—which will be available soon—is designed to enable the transfer of BW semantics from queries. This will allow semantics defined in SAP BW to be reused. We will closely monitor these developments and provide regular updates here. The following recorded SAP WebSession provides some initial insights.
Our scenario
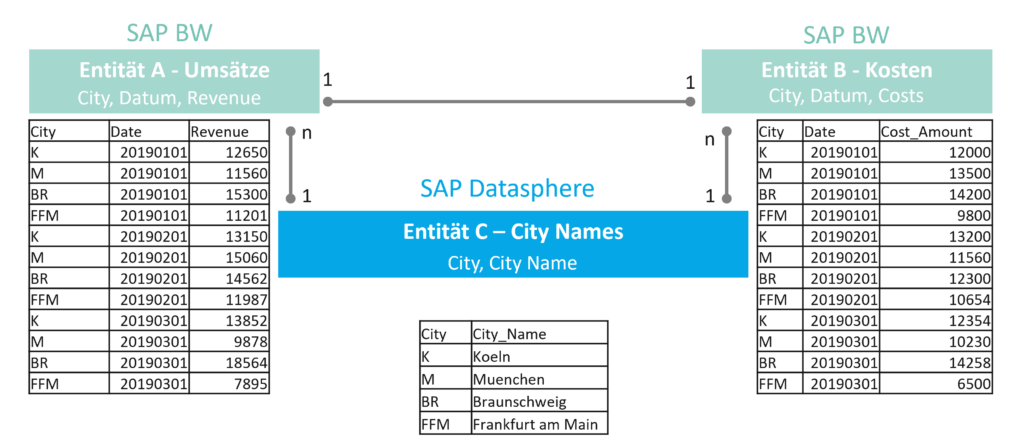
In our very simple scenario, we have two tables with transaction data containing sales and costs per retail area, in this case simply city.
The retail team would like to have a clear overview of how much profit is generated per time period in a specific city.
Data model in SAP BW/4HANA
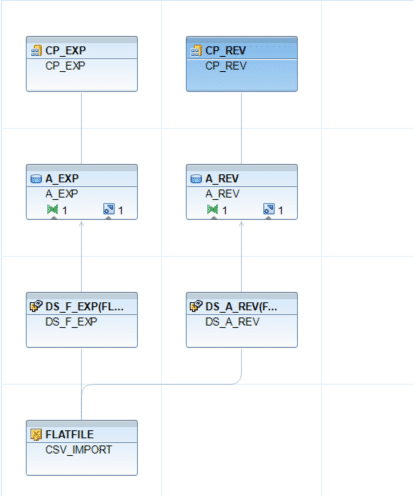
In SAP BW/4 HANA, the following simple data model exists for transaction data:
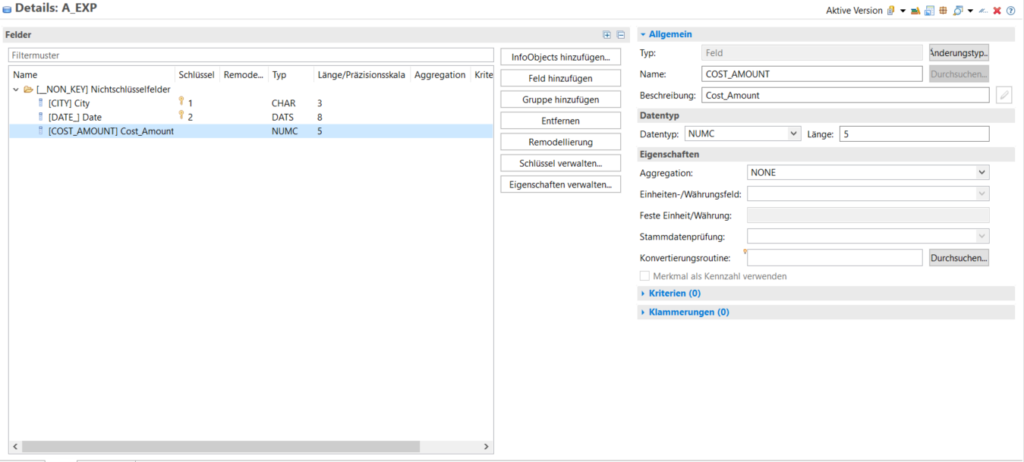
The aDSO cost has the following simple structure:
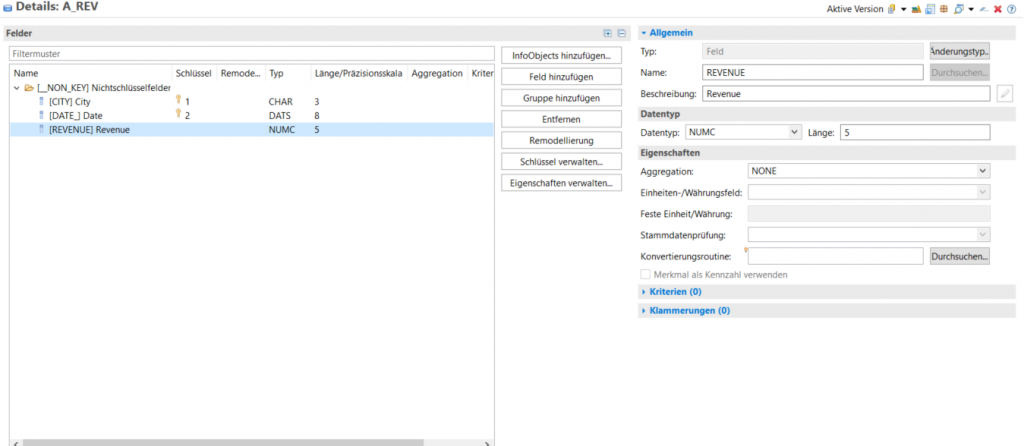
Structure of aDSO's turnover:
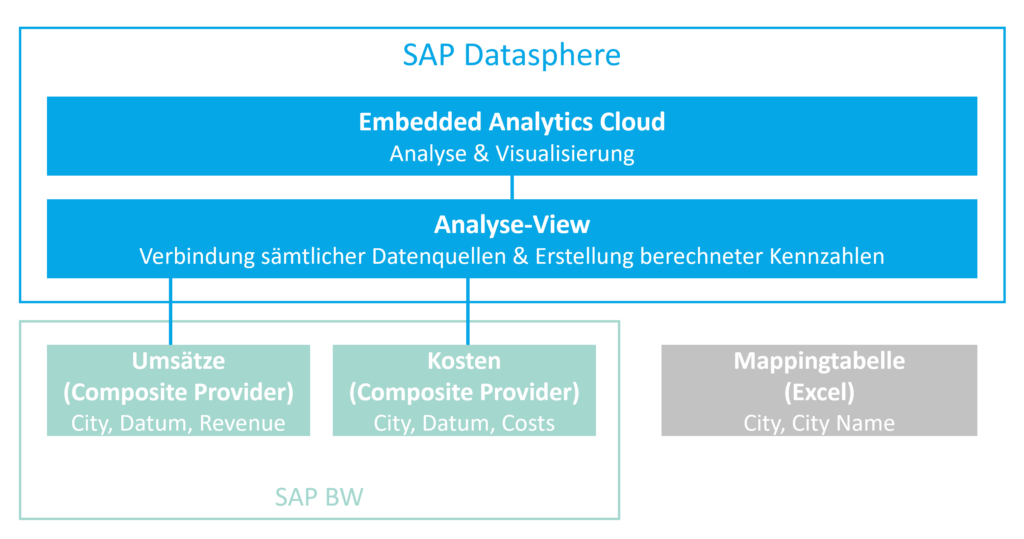
Our integrative SAP BW/4HANA scenario
In our fictional, very simple example, let’s assume that SAP BW does not contain any master data for the cities. However, a business unit has a CSV file that maps IDs to descriptions of the cities. In addition, the “Profit” column is to be calculated in Datasphere based on the BW/4 and CSV data. We have already created a table in Datasphere for the CSV file (see also: Datasphere – Introduction to Data Modeling).
Join the two composite providers
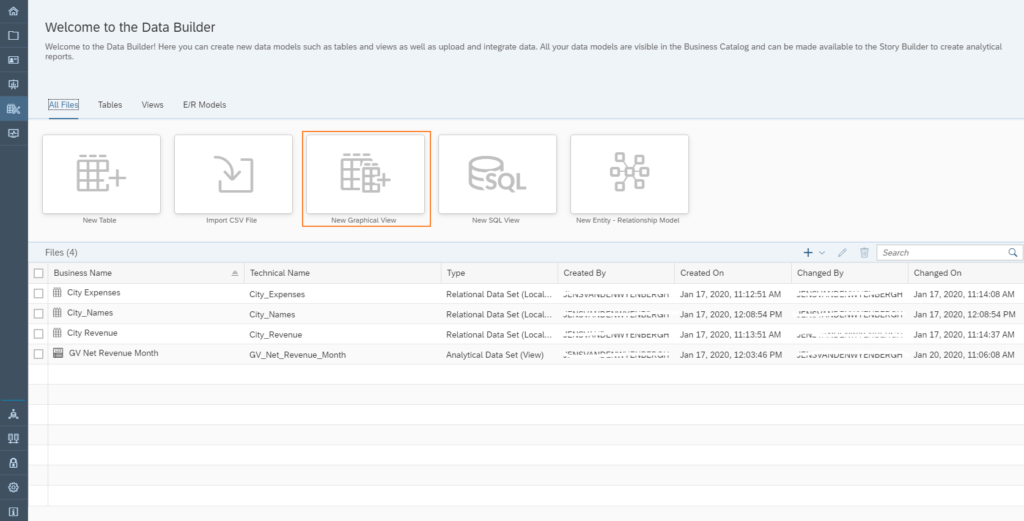
To integrate data from BW/4 into Datasphere, you must first set up the connection to BW/4, as described in the post “Datasphere Connection to Local Systems.” Once the connection is established, you can begin building a data model in Data Builder, regardless of the Datasphere source. In our case, we’ll create a graphical view:
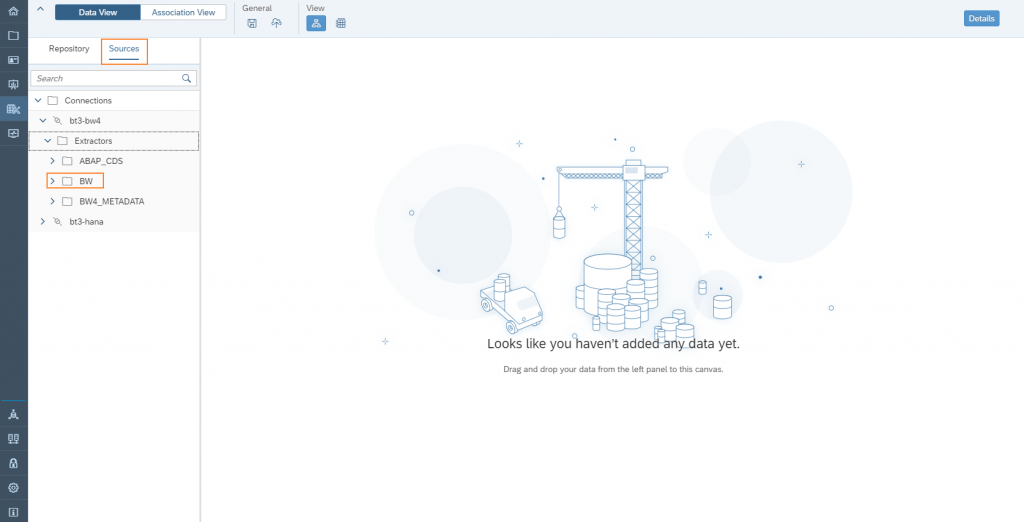
Navigate to remote sources → Select connection BW/4 or HANA
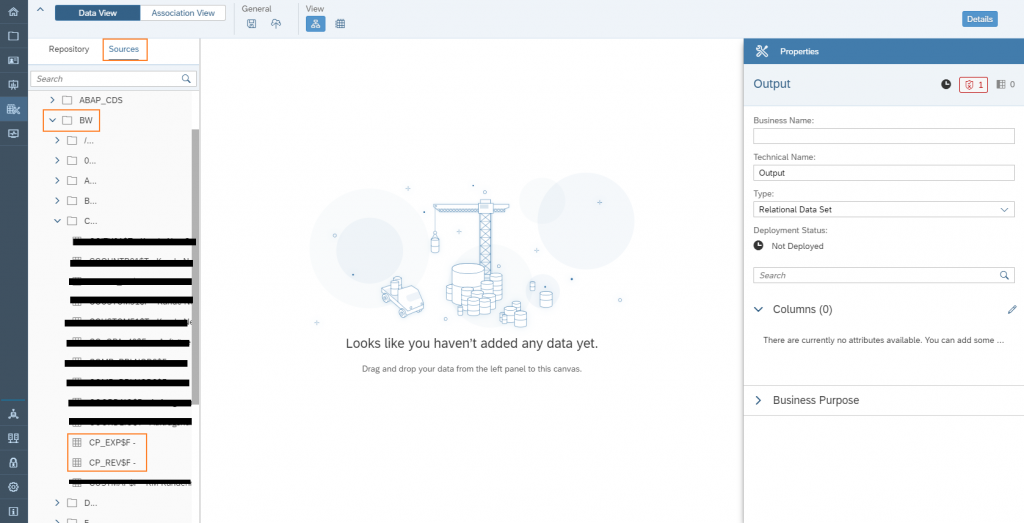
Add both CompositeProviders to the Graphical View.
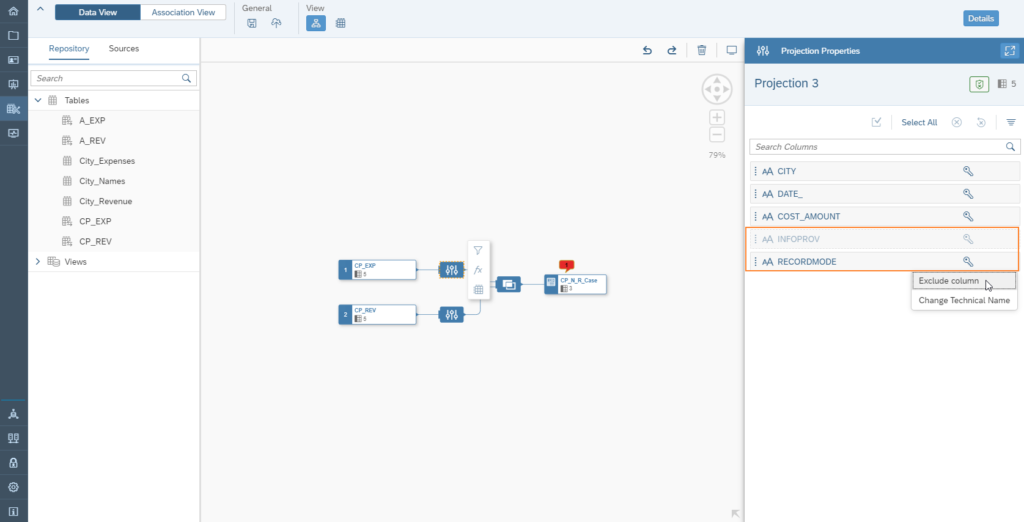
Hide the "InfoProv" and "Recordmode" columns for both CP_EXP and CP_REV.
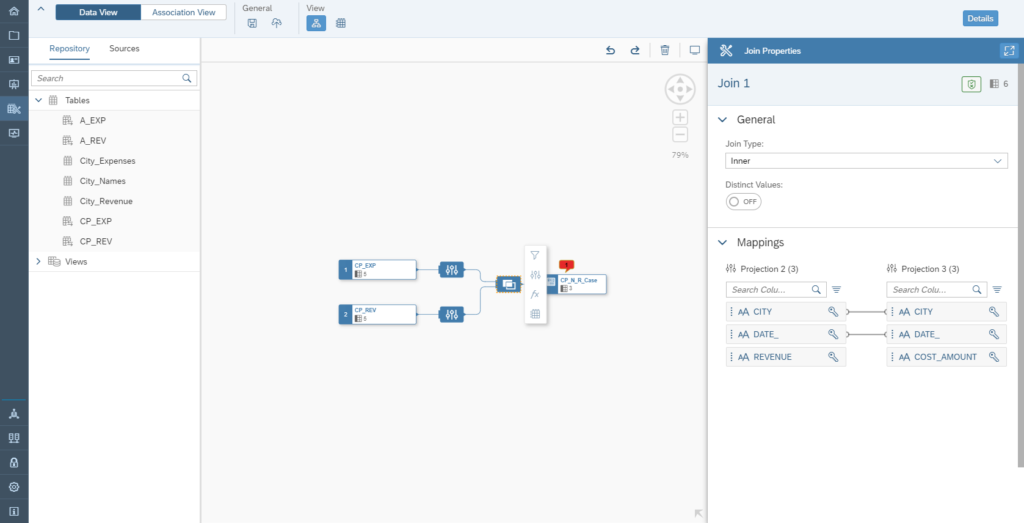
Check the join condition of the 2 CompositeProviders.
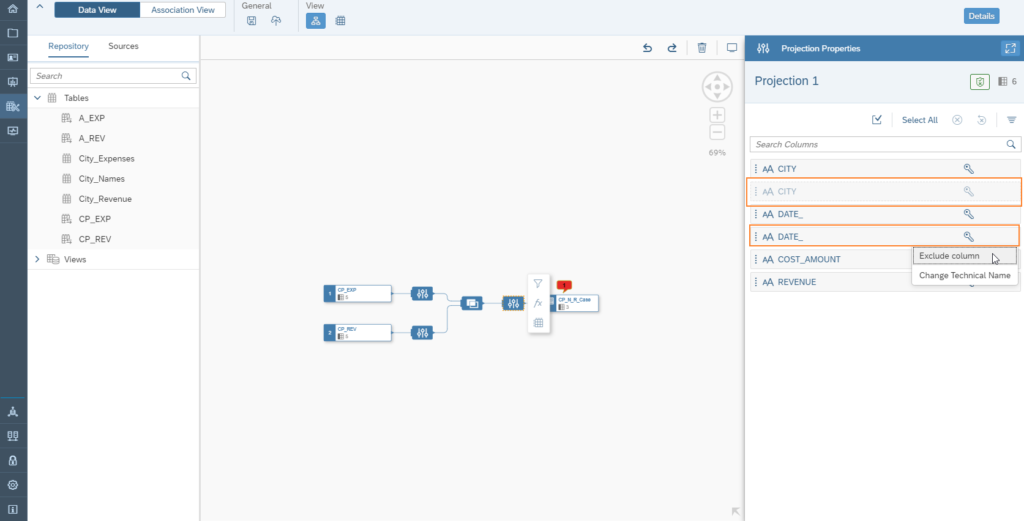
Hide the "City" and "Date" columns, as they are duplicates.
Et voilà:We have connected two SAP BW/4 HANA composite providers and joined them together. Uniform reporting is now possible.
Join the BW/4HANA data with the mapping table
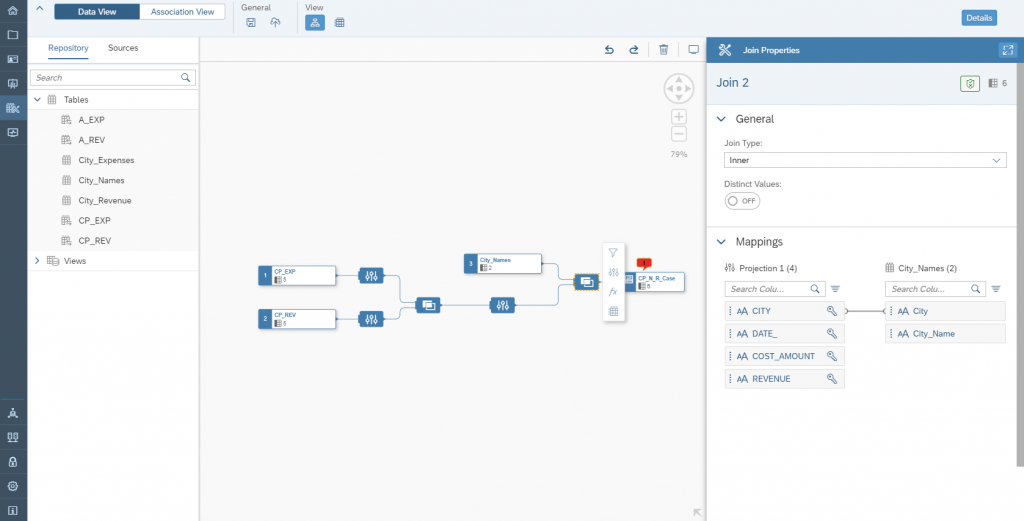
We have stored the names of the cities in a Datasphere table that is populated from a CSV file (for details, see also here). We can easily add this “City_Names” table to our graphical view:
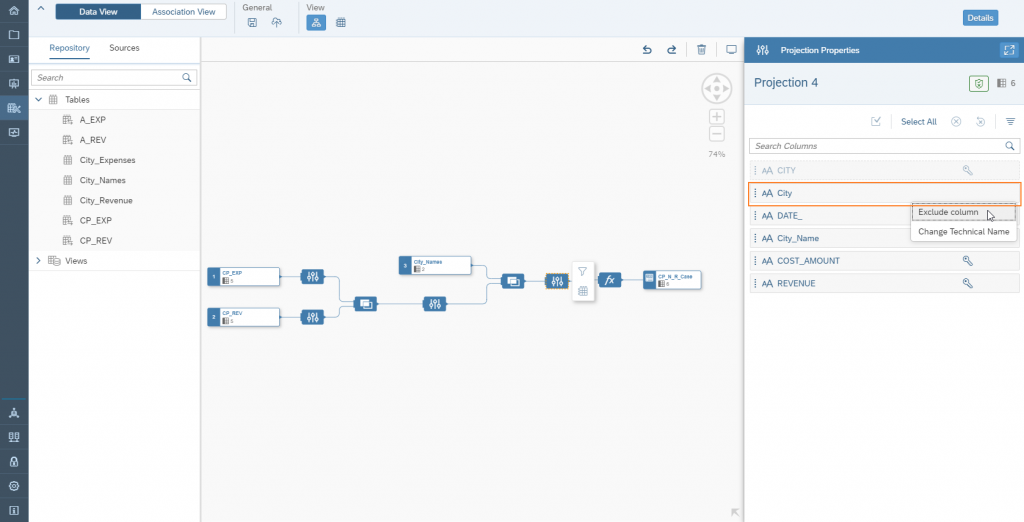
Hide the last "City" column, which contains only the abbreviations for the cities.
Creation of a calculated key figure based on the consolidated data
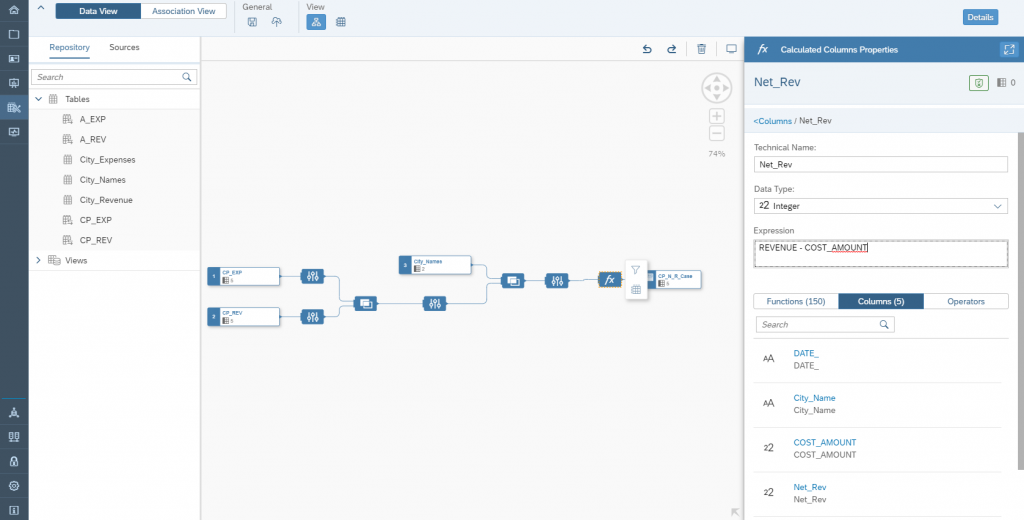
Our model is still missing the "Profit" metric. To add it, we'll create a new "Calculated Column":
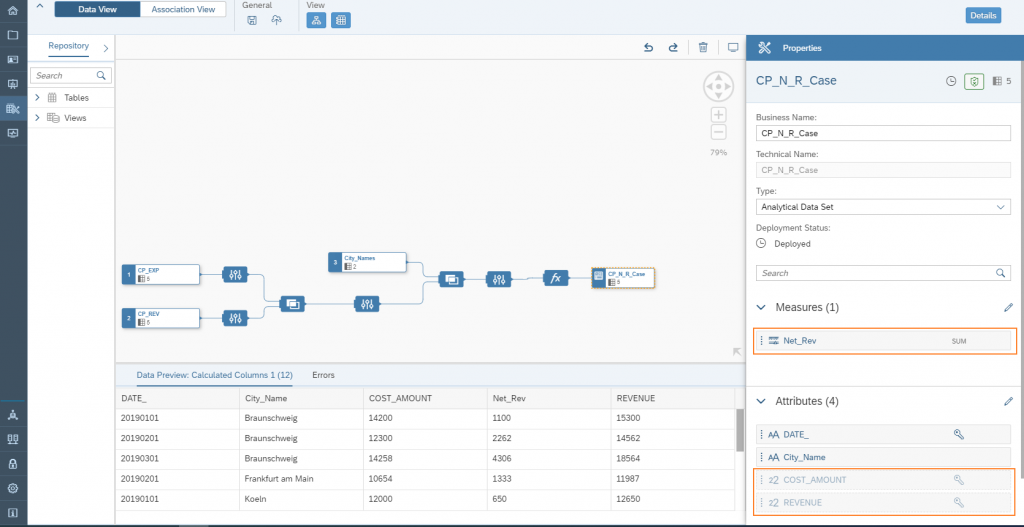
Note: To use the Graphical View in Storys, it must be deployed as an Analytical Data Set.
We will also hide the “Cost_Amount” and “Revenue” columns, since only profit will be considered in the subsequent analysis.
Visualization of data directly in the Datasphere
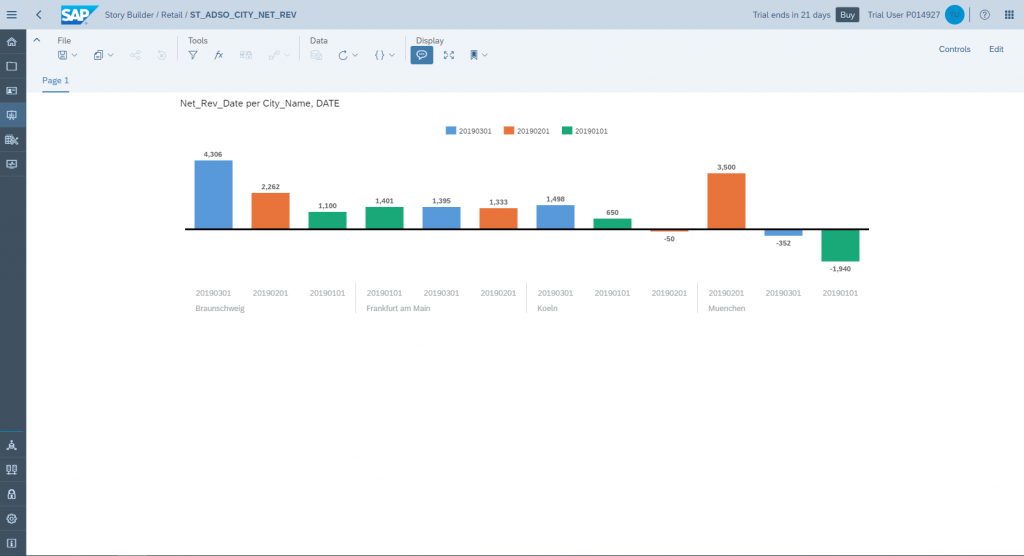
Based on our very simple mixed data model, we can quickly visualize the data using the integrated Storybuilder in SAP Analytics Cloud (SAC):
Summary and outlook
Christopher Kampmann
Head of Business Unit
Data & Analytics
christopher.kampmann@isr.de
+49 (0) 151 422 05 448