At the end of 2020, SAP Datasphere was expanded to include Business Builder. What exactly does that mean, and what is Business Builder all about? We'll give you an overview.
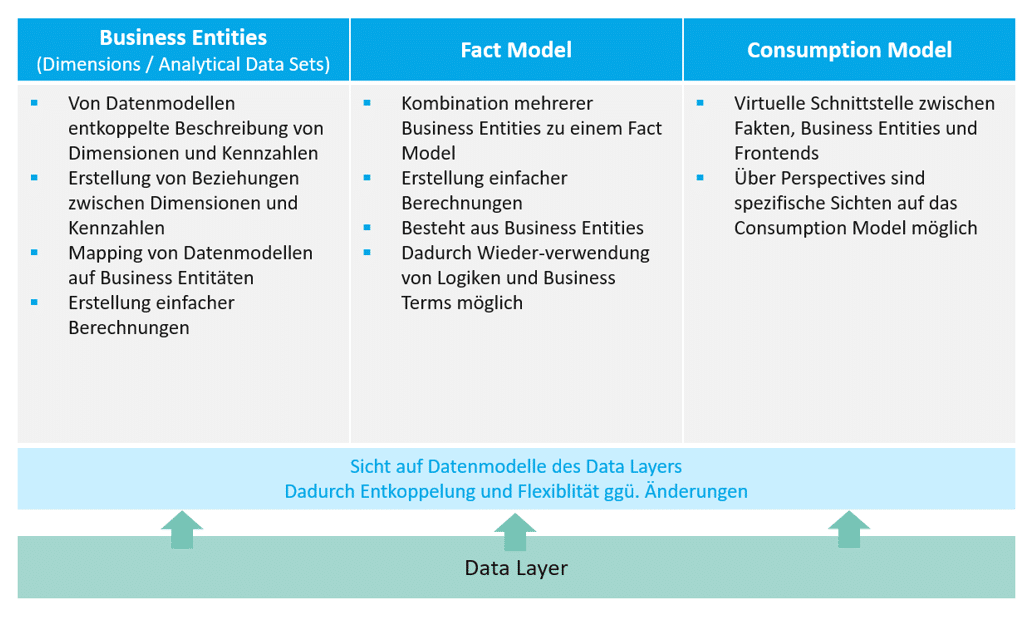
Business entities are a closed view of the data layer and represent a business entity (e.g., product, time, revenue). There are two types:
Dimension:
Dimensions represent pure master data tables, which can contain both attributes and text. In subsequent modeling, these can either be associated with analytical datasets or made visible as “exposed dimensions” for fact models.
Analytical Dataset:
Analytical datasets contain fact tables that include key figures and foreign keys. The foreign keys can then be used to retrieve the corresponding master data from associated dimensions.
Fact Model
A fact model makes it possible to combine multiple business entities as facts and dimensions and to create calculations across multiple key figures. Fact models are typically used to map more complex but generic metrics or KPIs (e.g., pipeline coverage). The complexity can arise, for example, from linking multiple analytical data sets.
Consumption Model
A consumption model maps a specific use case and enables the combination of business entities and fact models. Together with the perspective, they form the highest level within the Business Builder. Perspectives make it possible to limit the exposed attributes and key figures so that only the relevant data is transferred to the consuming front-end tools (e.g., SAC). Several perspectives can be based on a consumption model.
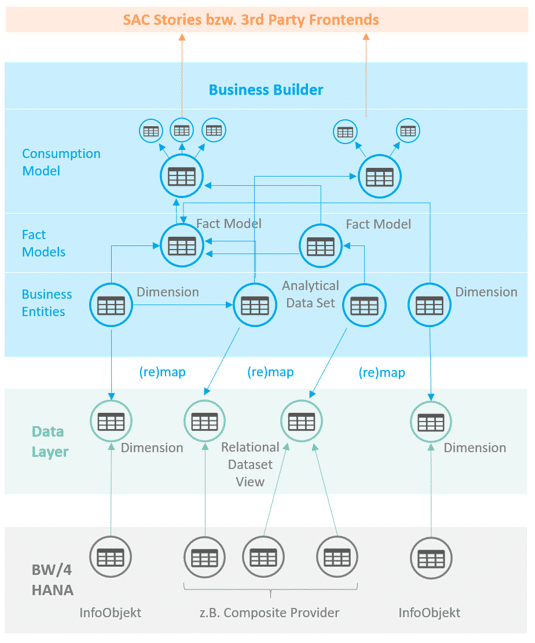
Connection between the data layer and the modeling objects of the Business Builder
Fig. 3: Modeling objects Business Builder | isr.de
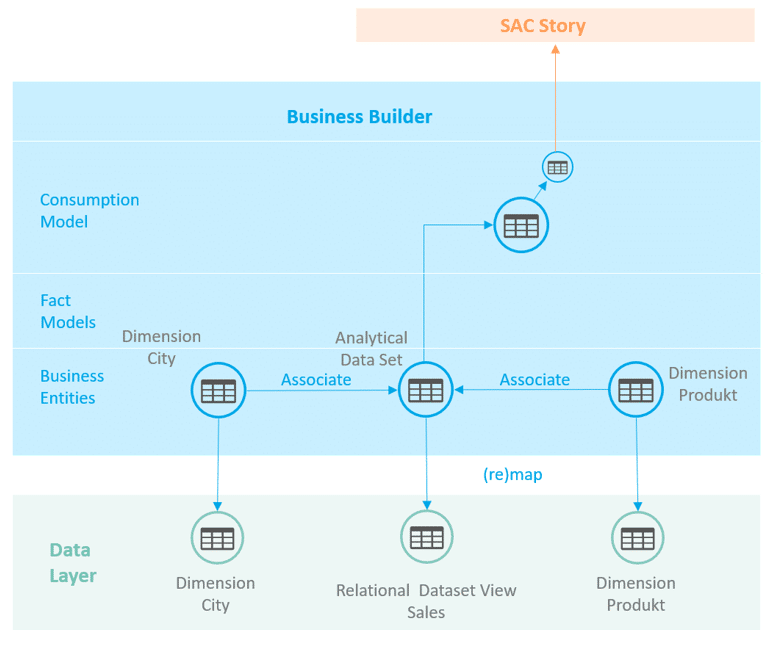
In the simple model, we create two dimensions and an analytical data set, which is mapped to objects in the data layer. Thanks to the virtual connection, it would theoretically be possible to swap the tables in the data layer. This is what makes Business Builder so flexible. We integrate the analytical data set, including the associations, into a consumption model on whose perspective a story can be built in the Analytics Cloud.
Fig. 4: Example of Business Builder modeling | isr.de
Dimensions: City and Product
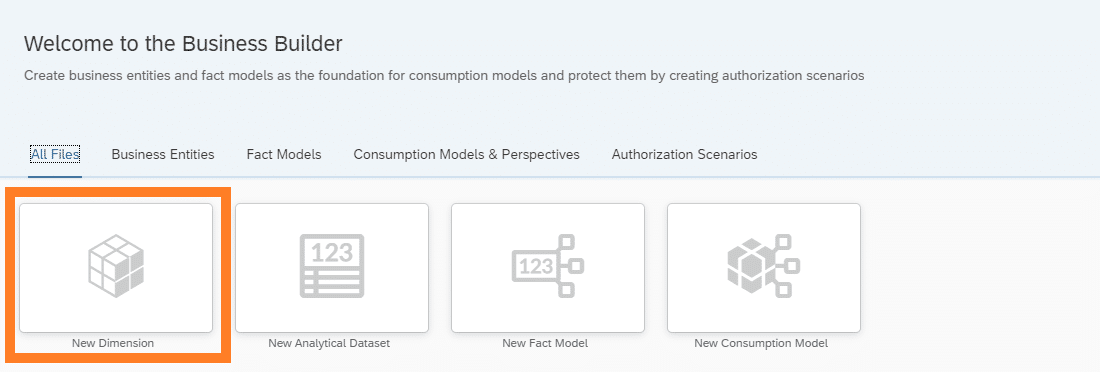
To begin, create a dimension from the product table. To do this, select the “New Dimension” tab in Business Builder.
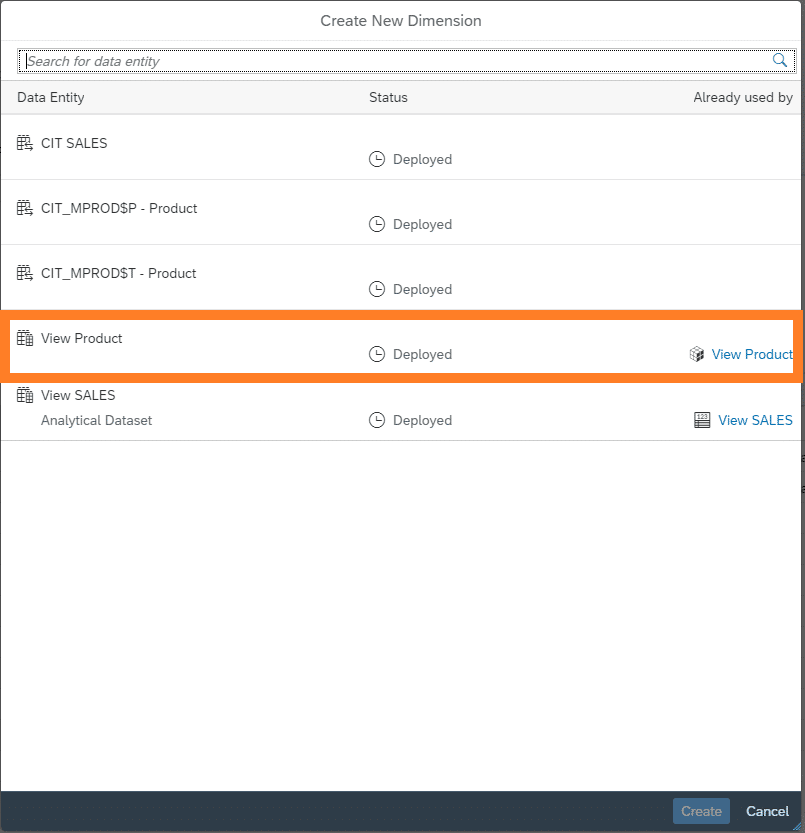
Next, select the "Product" table or view that has been "loaded" into Datasphere.
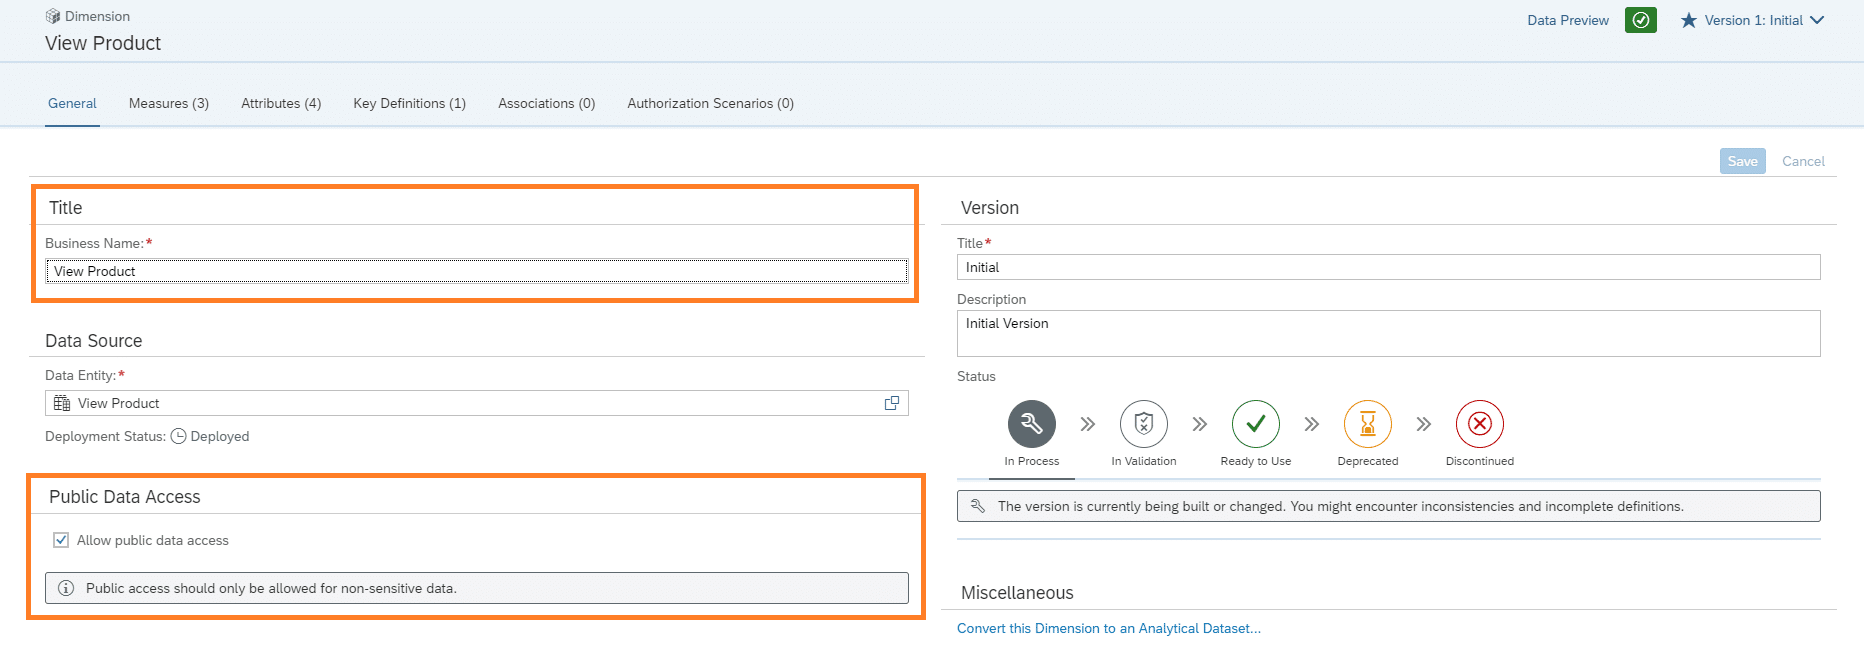
Next, settings such as visibility or the name for the dimension must be selected. Then, click the Save button to save your changes.
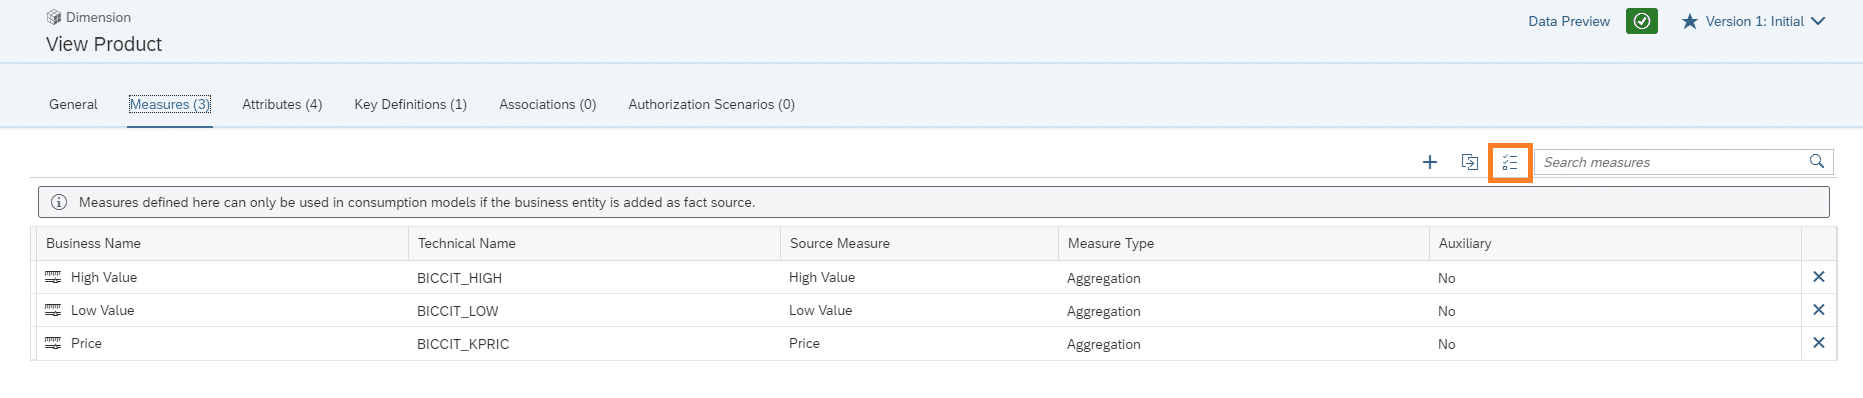
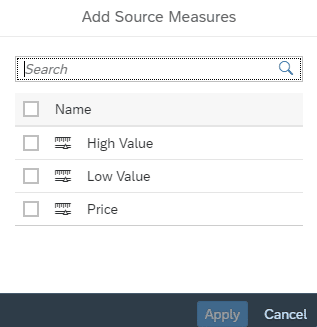
In the next step, the measures for the dimension are added via the selected area.
The required measures are selected in a new dialog box.
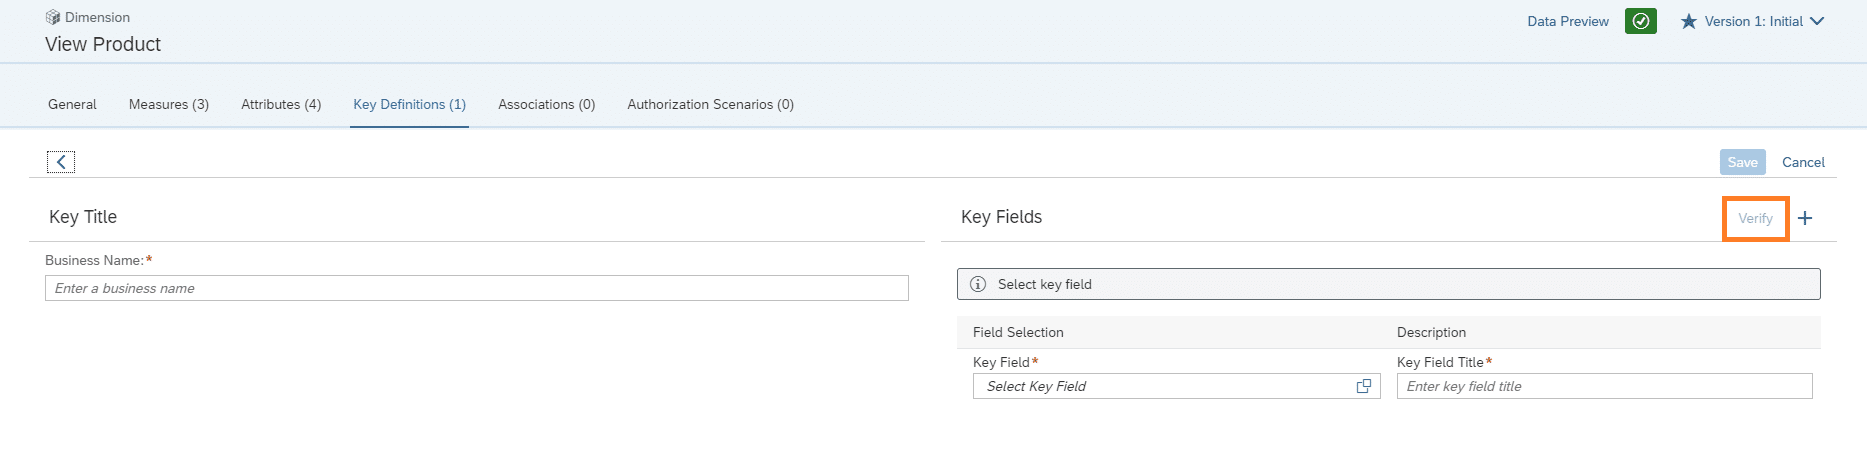
The procedure is carried out in the same way for the attributes. After selecting the required measures and attributes, the key for the dimension must be defined and verified using the Verify button. The dimension creation is then successfully completed.
Similarly, a dimension is created for the master data of the city.
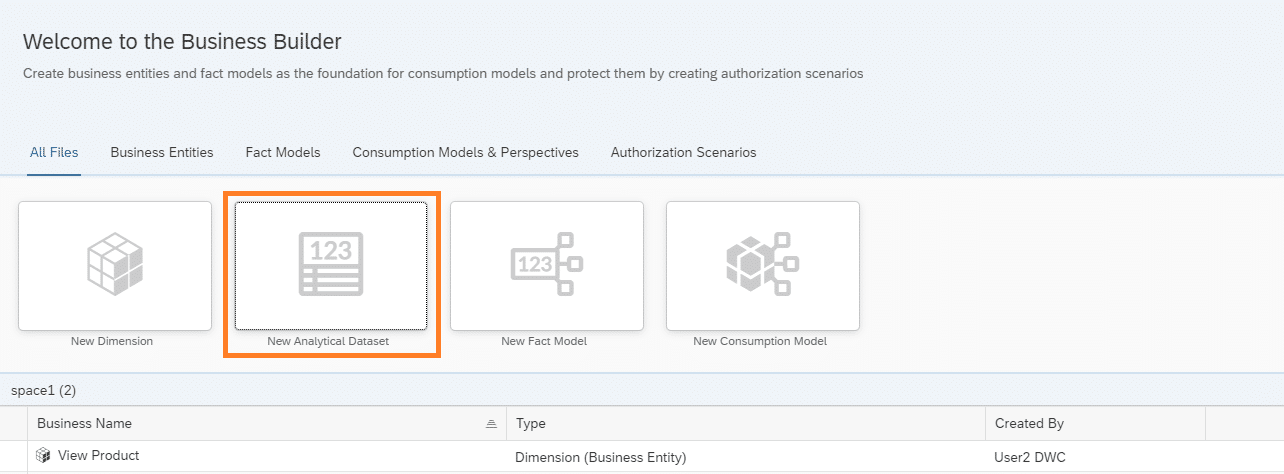
Analytical Dataset Sales
After successfully creating the dimension in the product master data, a new analytical dataset is required for the sales data. This can be done using the “New Analytical Dataset” tab.
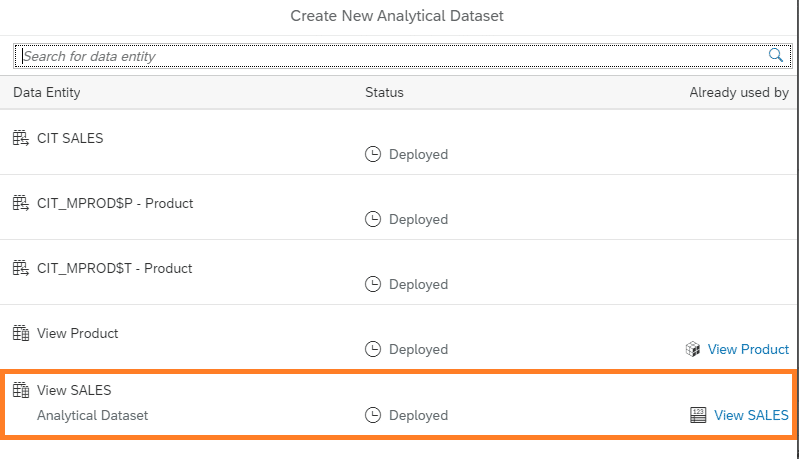
The next step is to select the view of the sales data in the Datasphere.
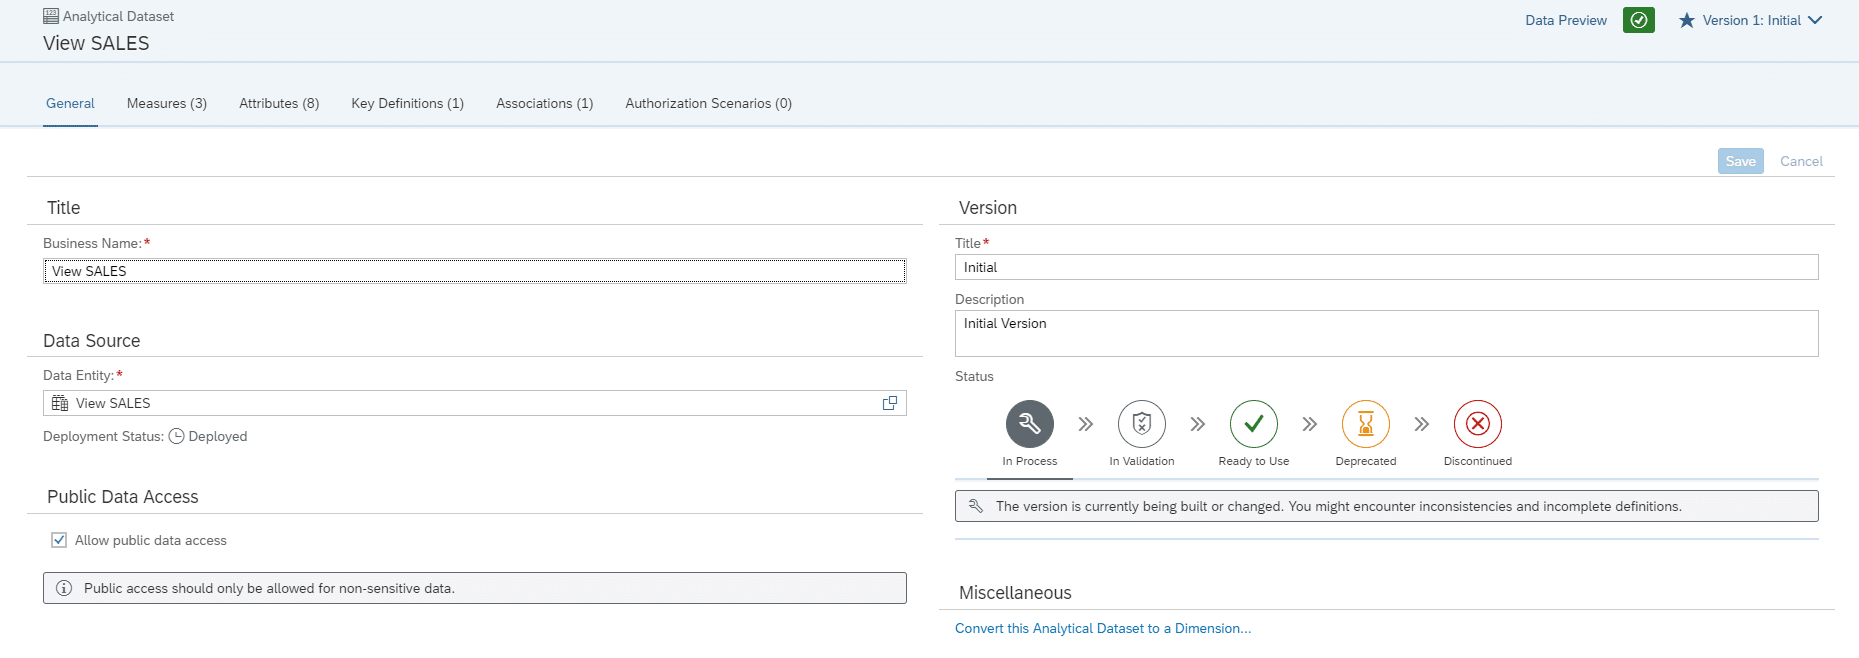
After selecting the appropriate data, the general settings for the analytical dataset are configured. These include the name, version, and data access.
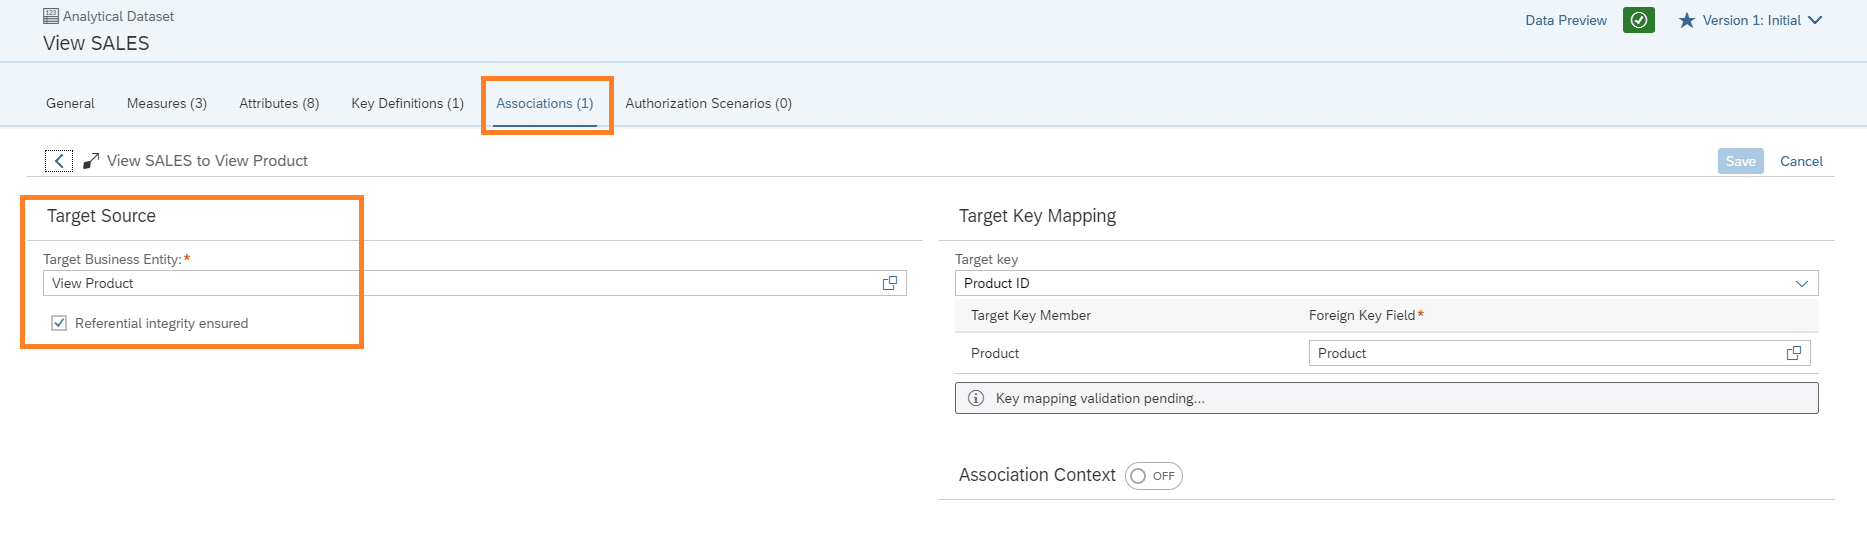
As with the dimension, the measures, attributes, and key must be defined for the analytical dataset. To create a connection between the product dimension and the analytical dataset of the sales data, an association is created here, which is implemented by the previously defined key.
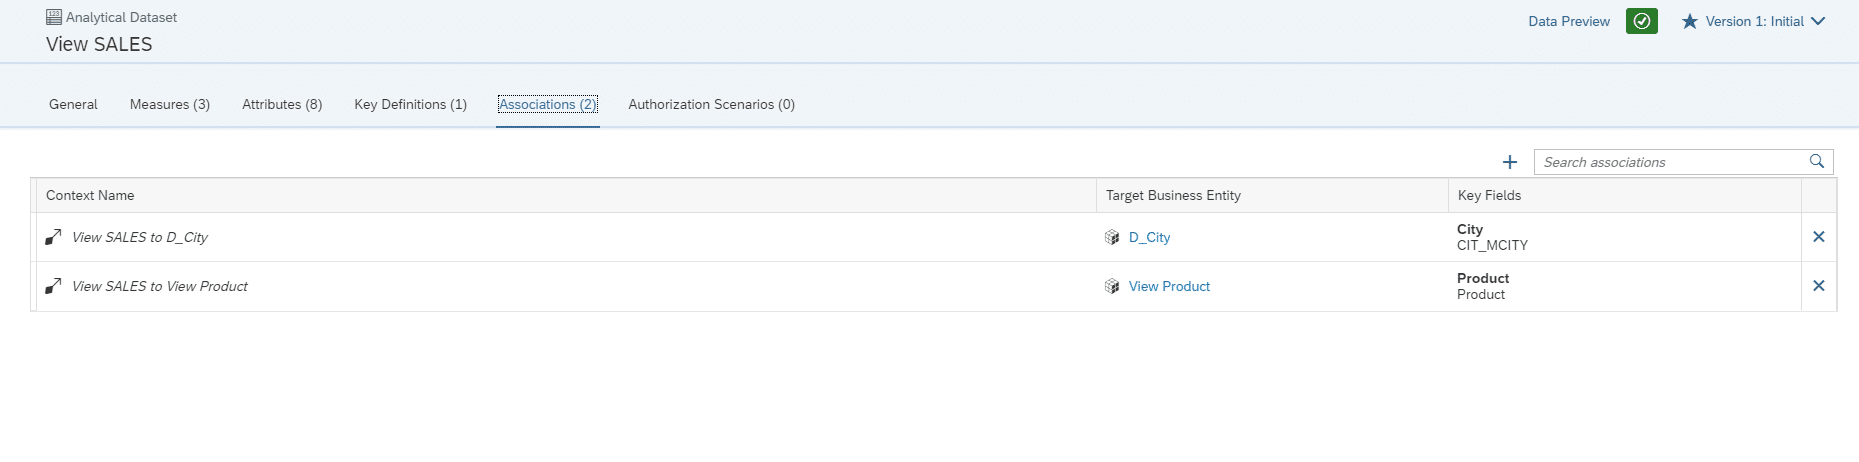
Similarly, the dimension of stores is also associated.
Consumption Model
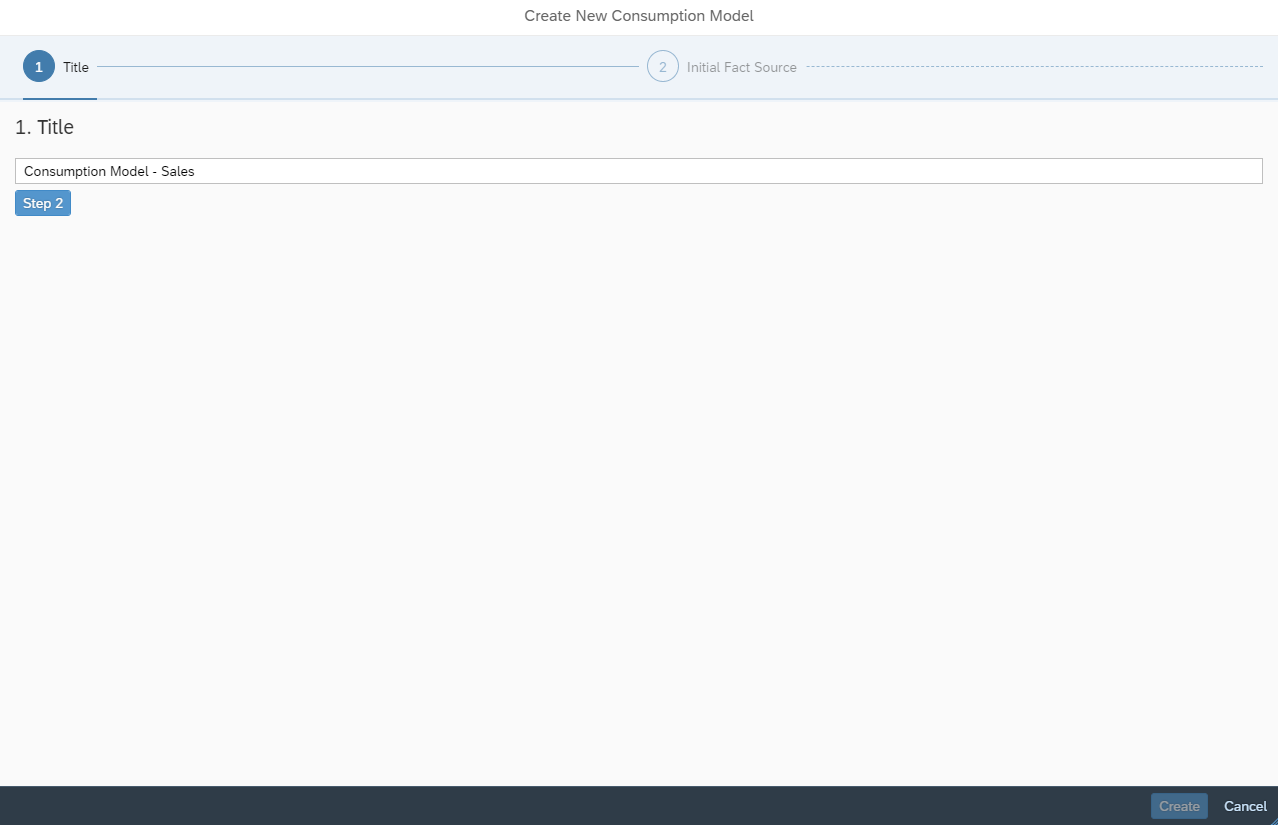
Once the analytical dataset has been deployed, you can begin modeling the consumption model. The consumption model is needed to create a story based on it later on.
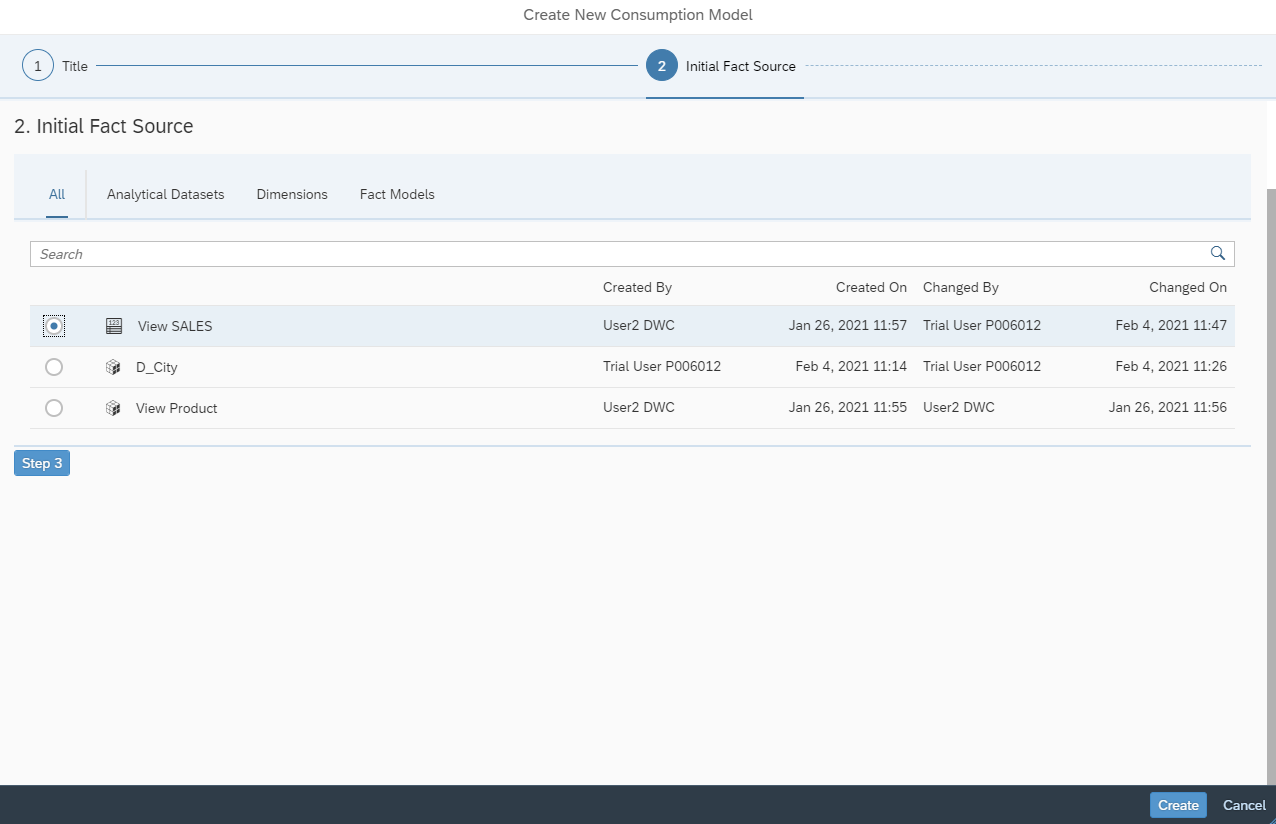
In the next step, the consumption model must be named.
Next, select the data source, in this case the analytical dataset for sales data.
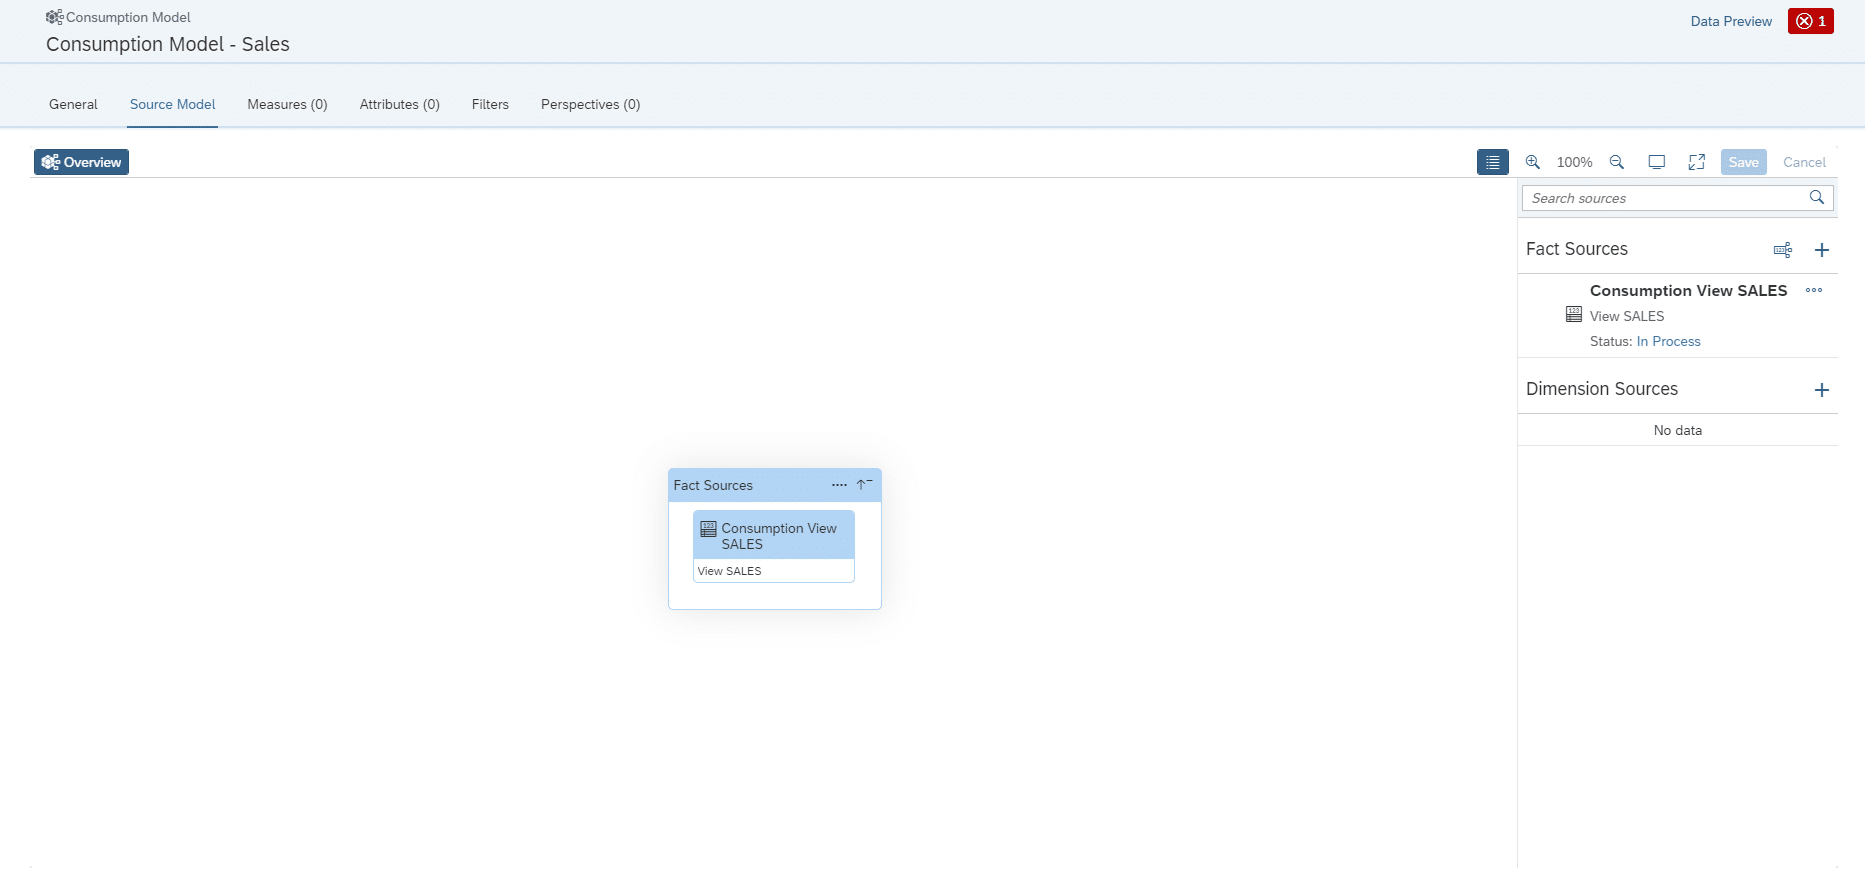
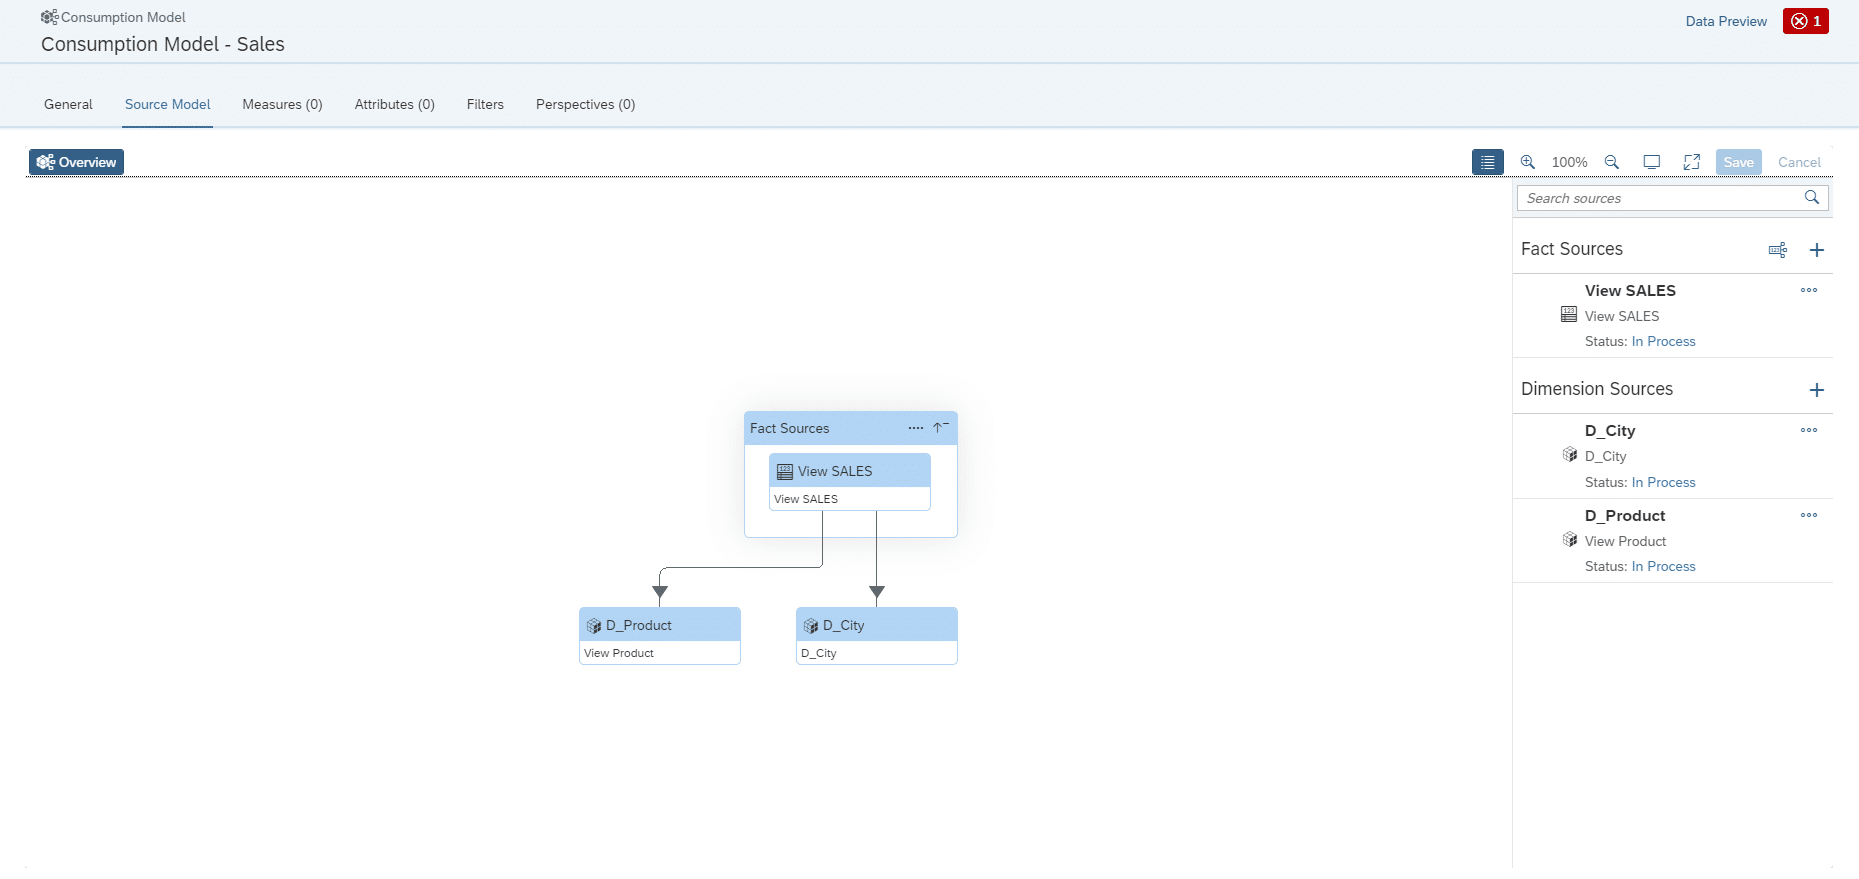
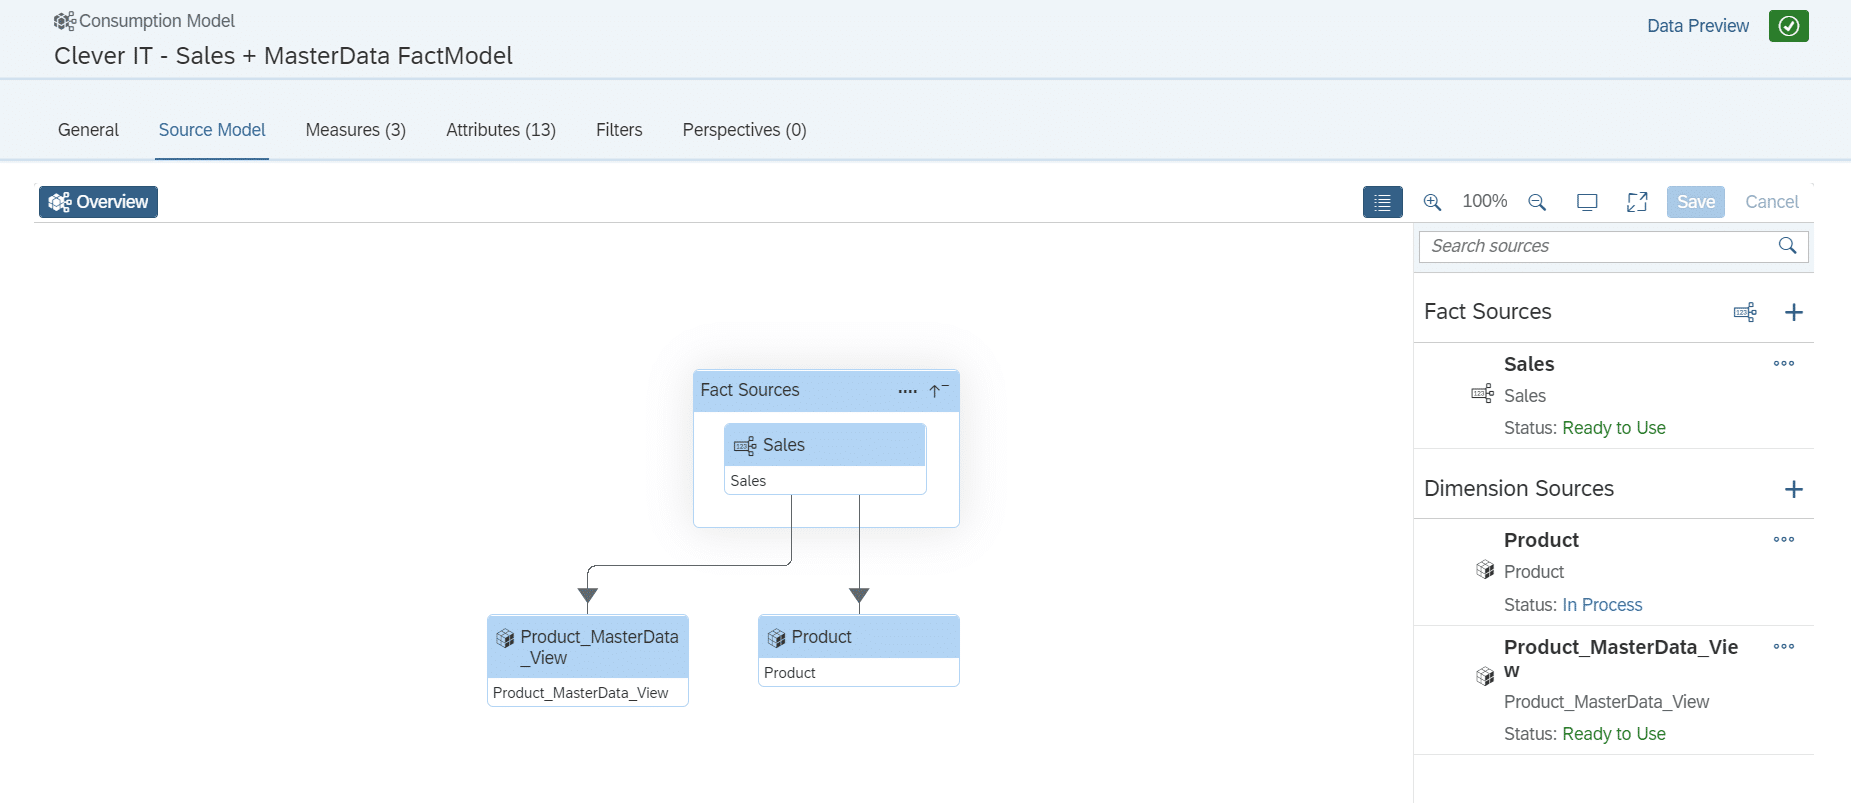
Next, the analytical dataset is created as a fact source in the consumption model.
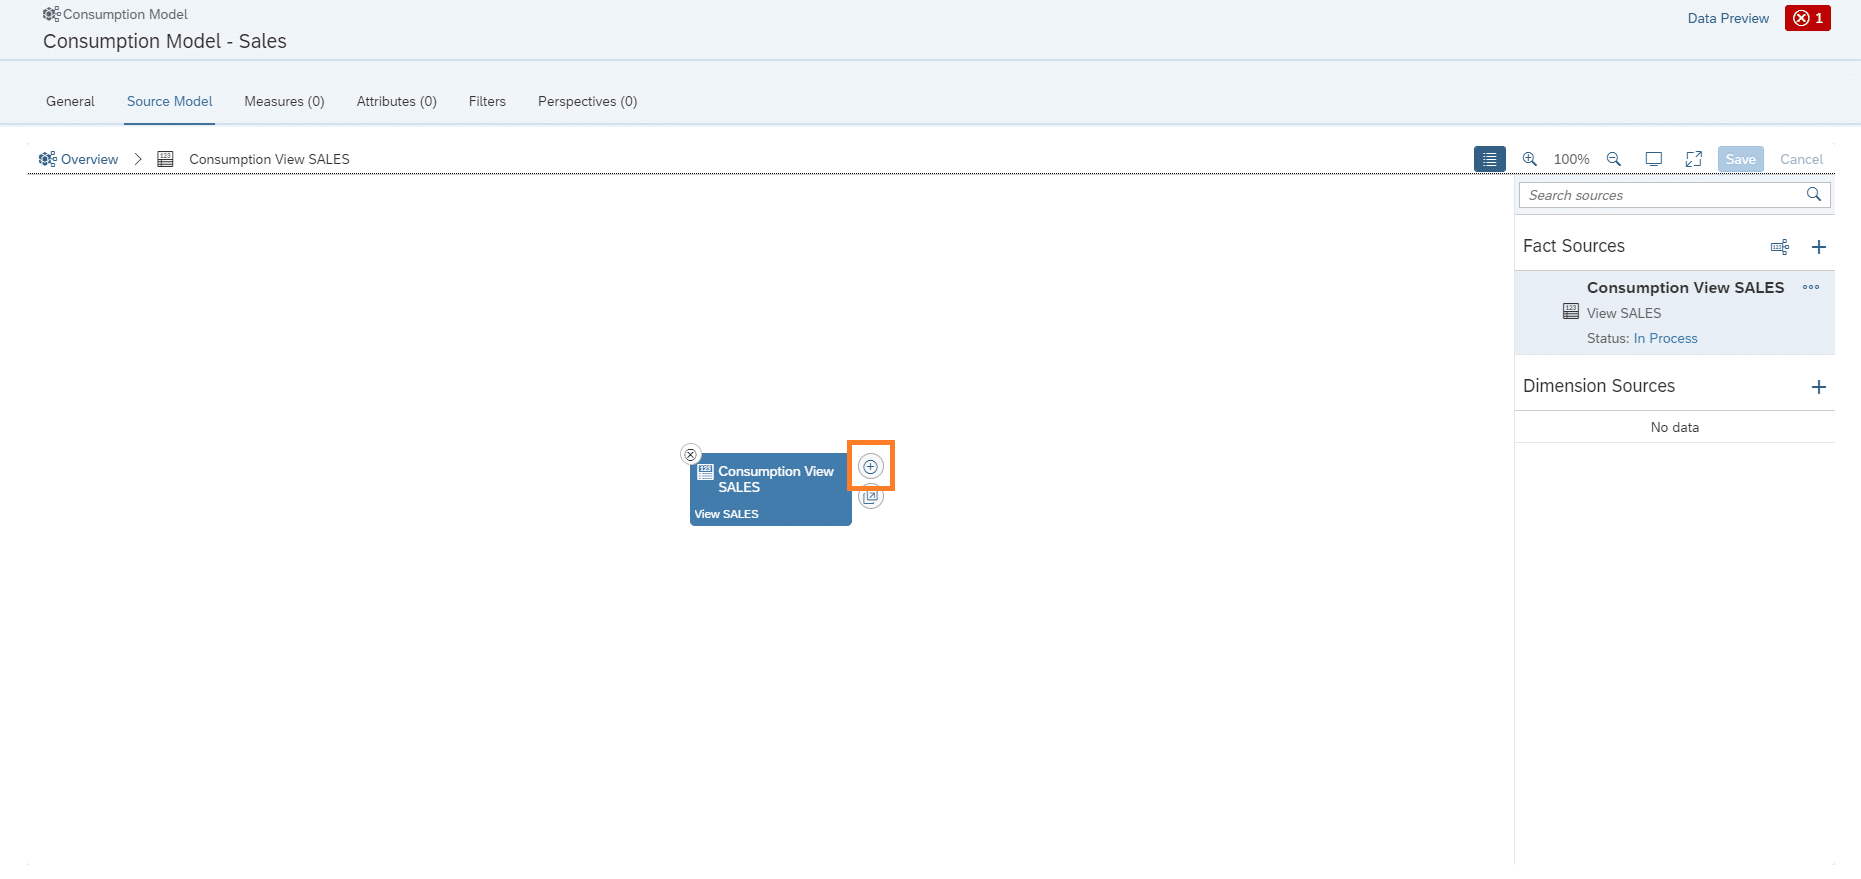
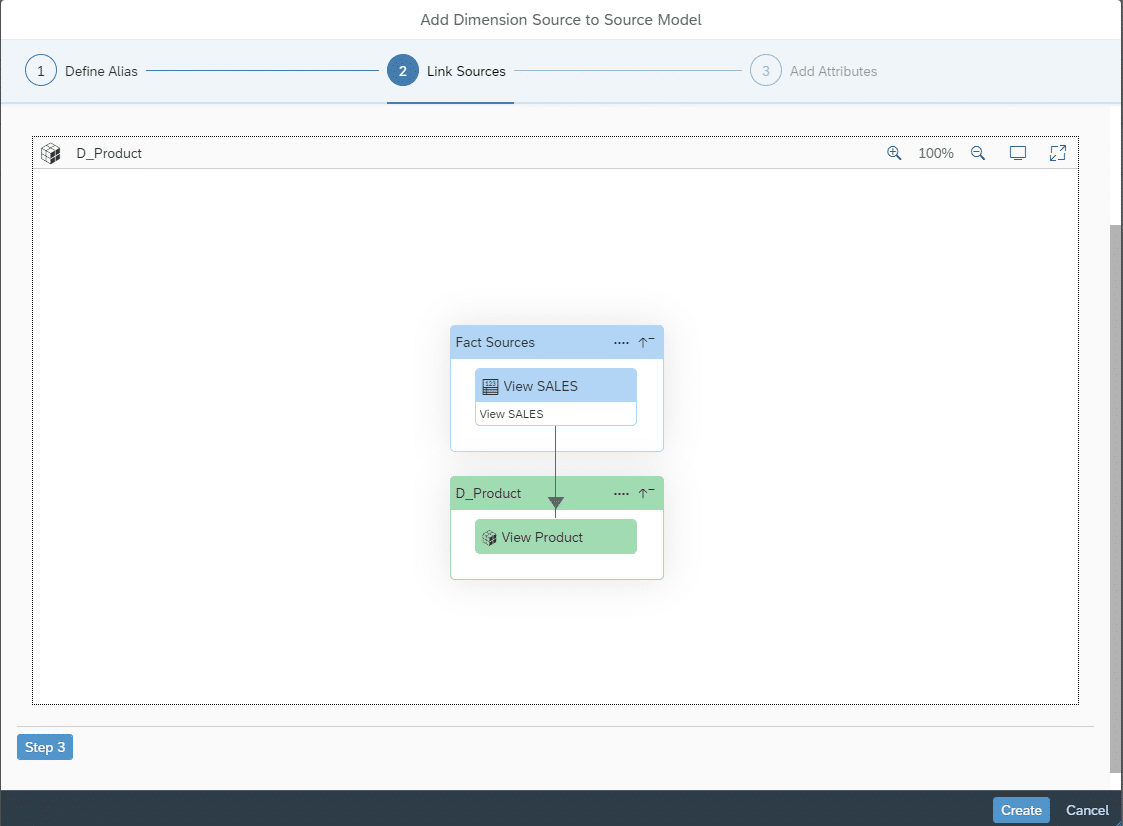
To add the "Associated" dimension to the product data, select the dimension here using the "+" button.
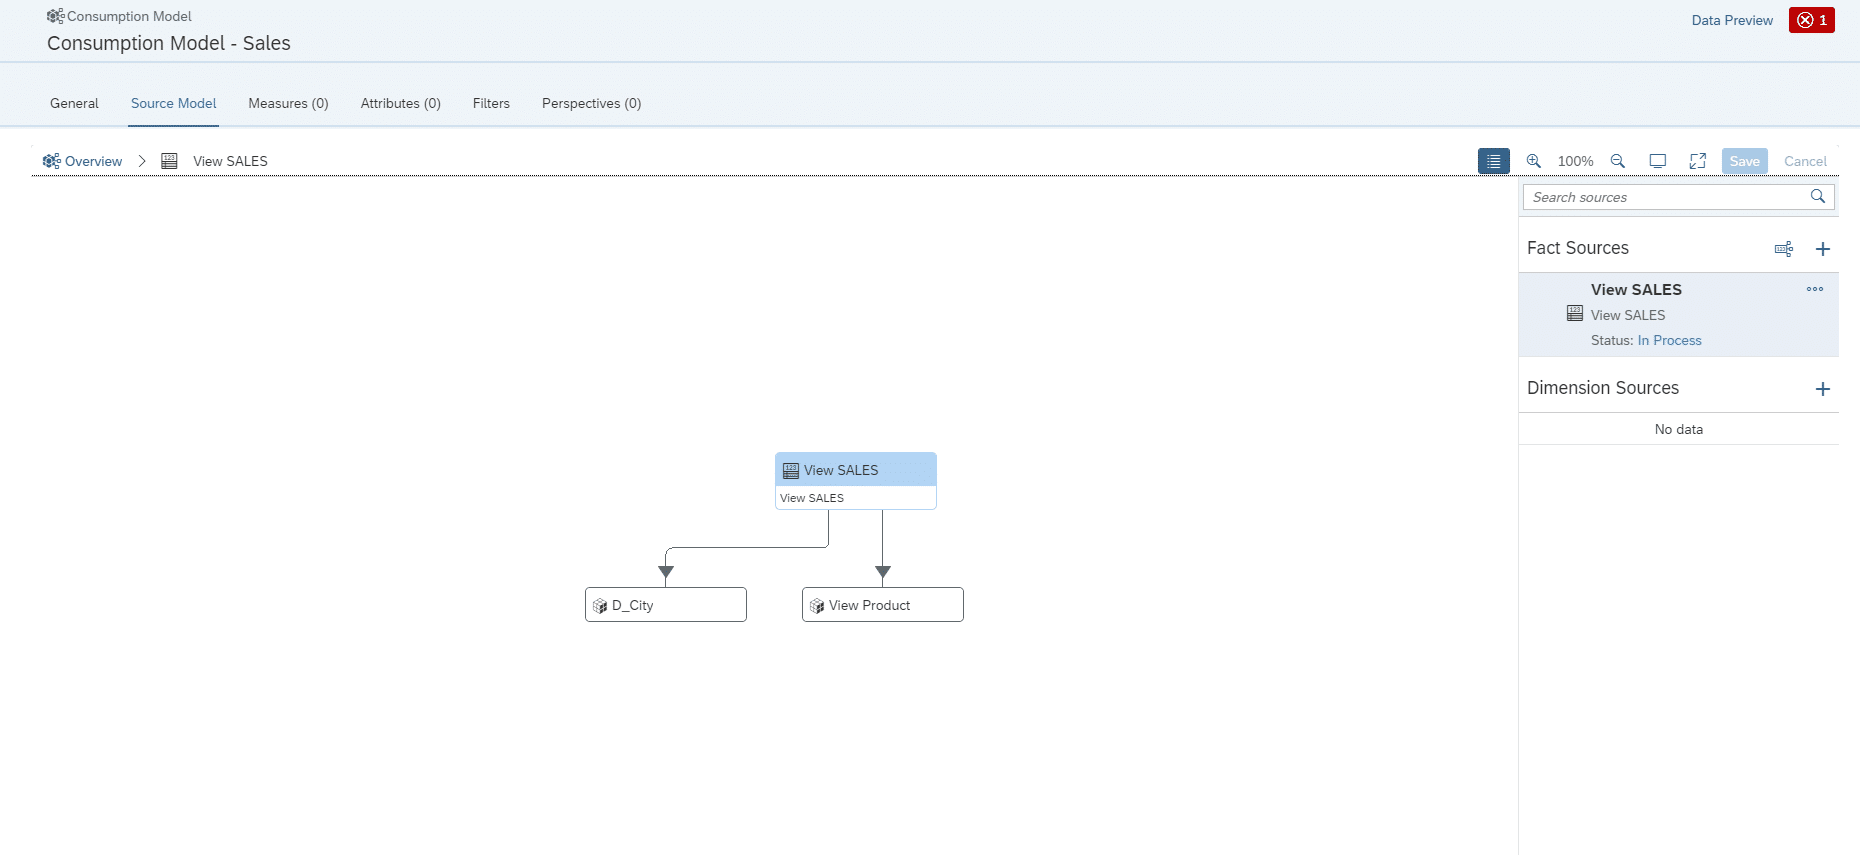
In the next step, the dimensions must be added individually.
The same must be done for the dimension of the stores. Once the names have been assigned, the model is almost complete.
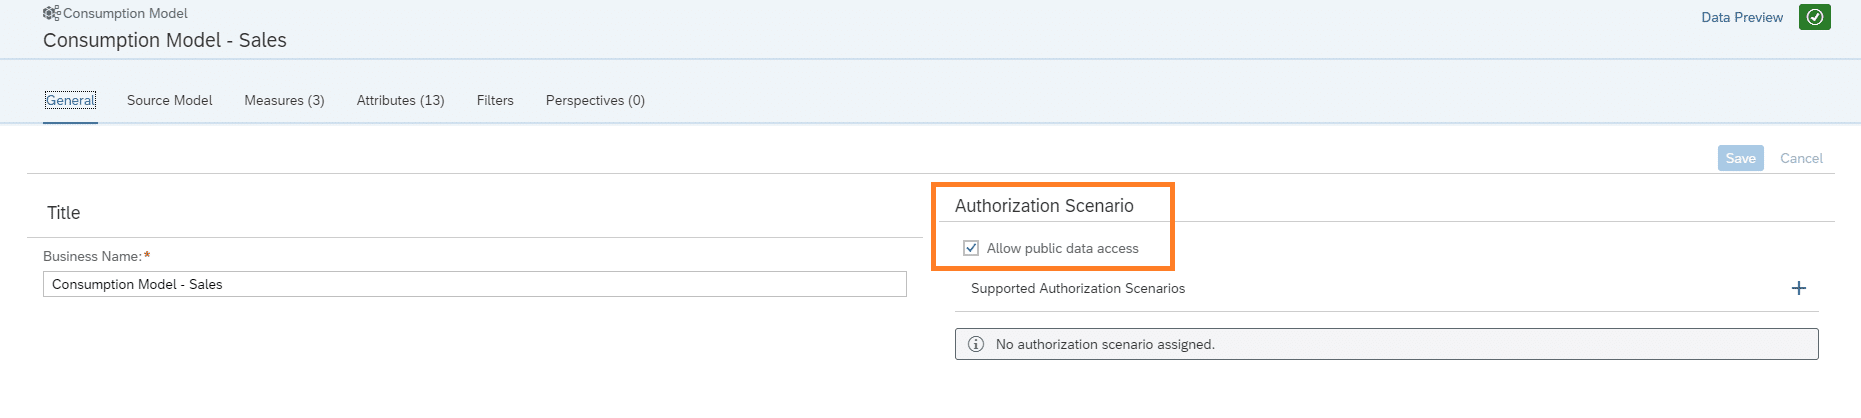
As before, measures and attributes must be assigned. In order to be able to use the consumption model later without any problems, data access must be authorized here.
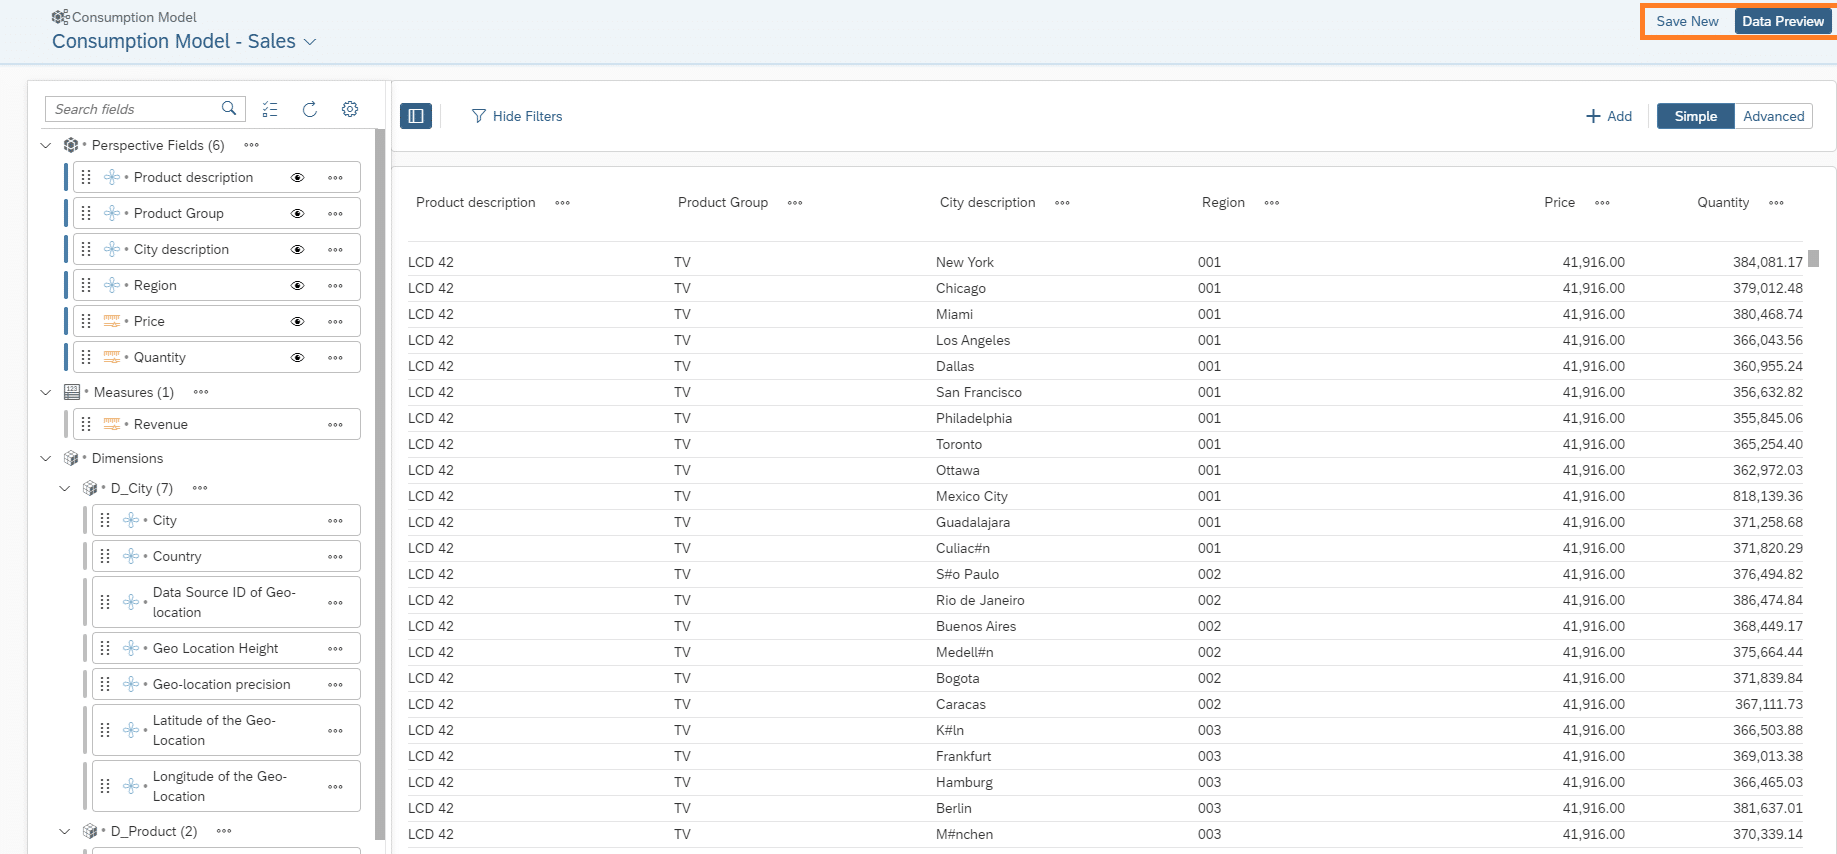
A new feature of the Consumption Model is the Perspective, in which the measures and attributes to be used later in a story are selected.
Selection of fields:
After a successful deployment, a "Data Preview" can also be displayed.
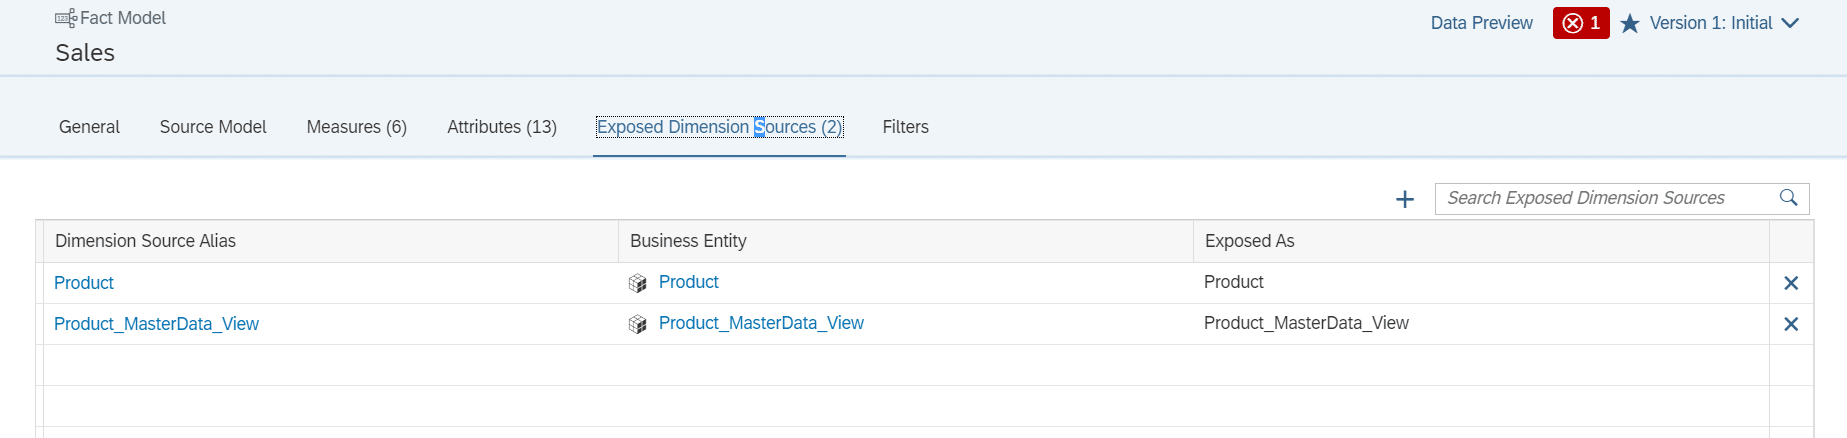
If a fact model is to be used in the consumption model instead of an analytical data set, the associated dimensions must be created as exposed dimension sources in the fact model.
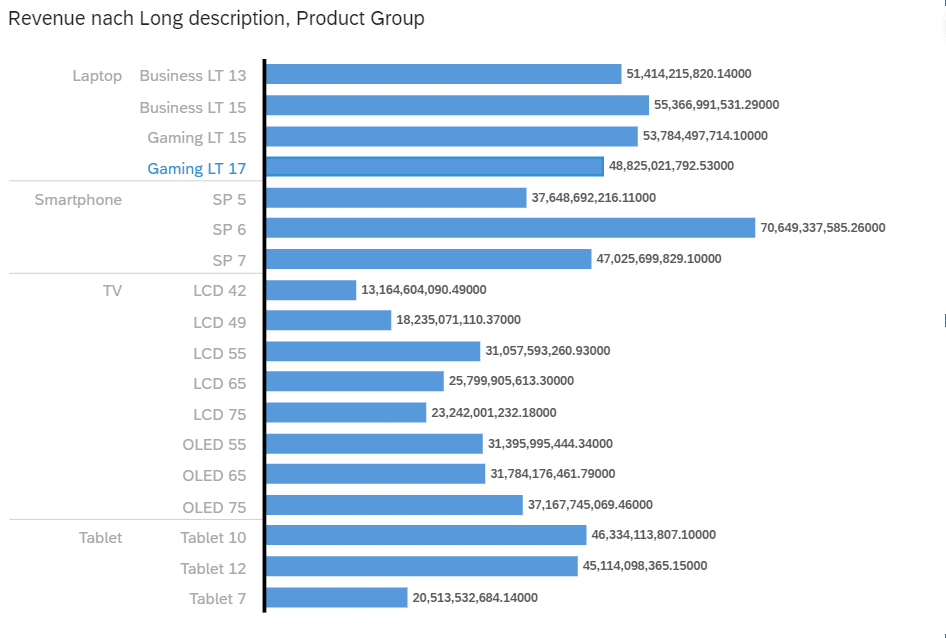
Visualization in Storybuilder by revenue per product and product group
In principle, it is also possible to restrict access to all objects using data access control.
Our first impression
In an increasingly complex business world, with dynamically changing corporate requirements and ever-growing volumes of data, it is essential to have a well-organized and powerful IT landscape. This is particularly true in the context of business intelligence, where important decisions are made on the basis of the available data.
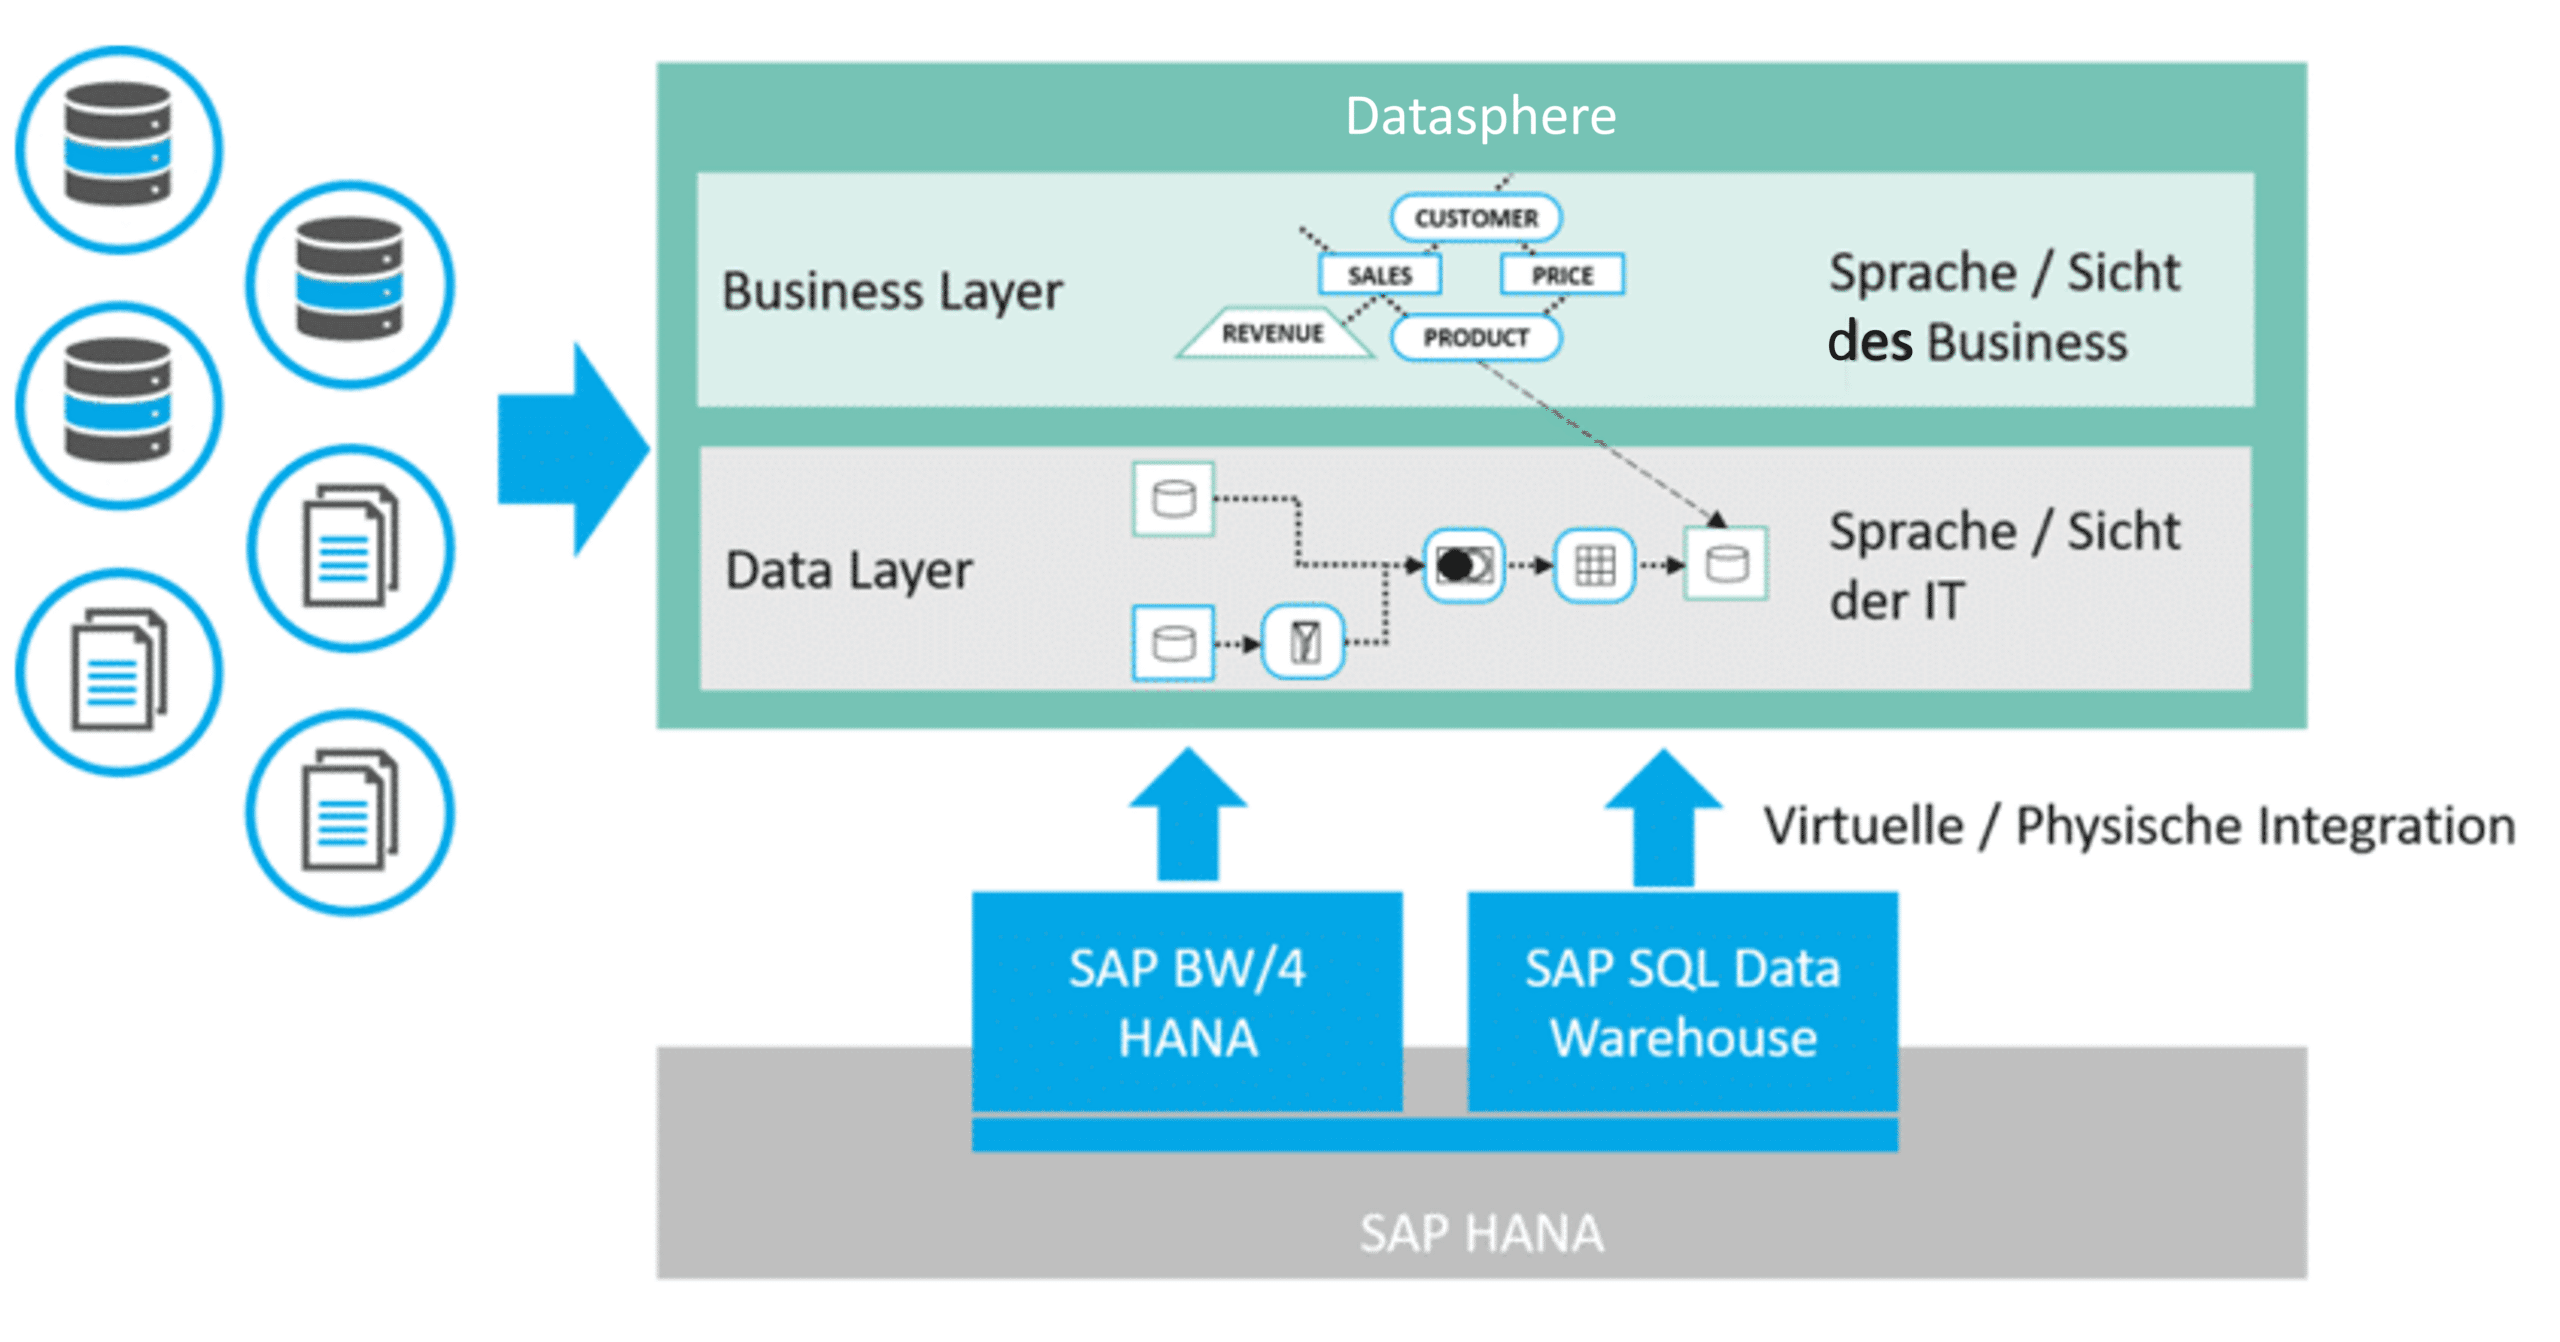
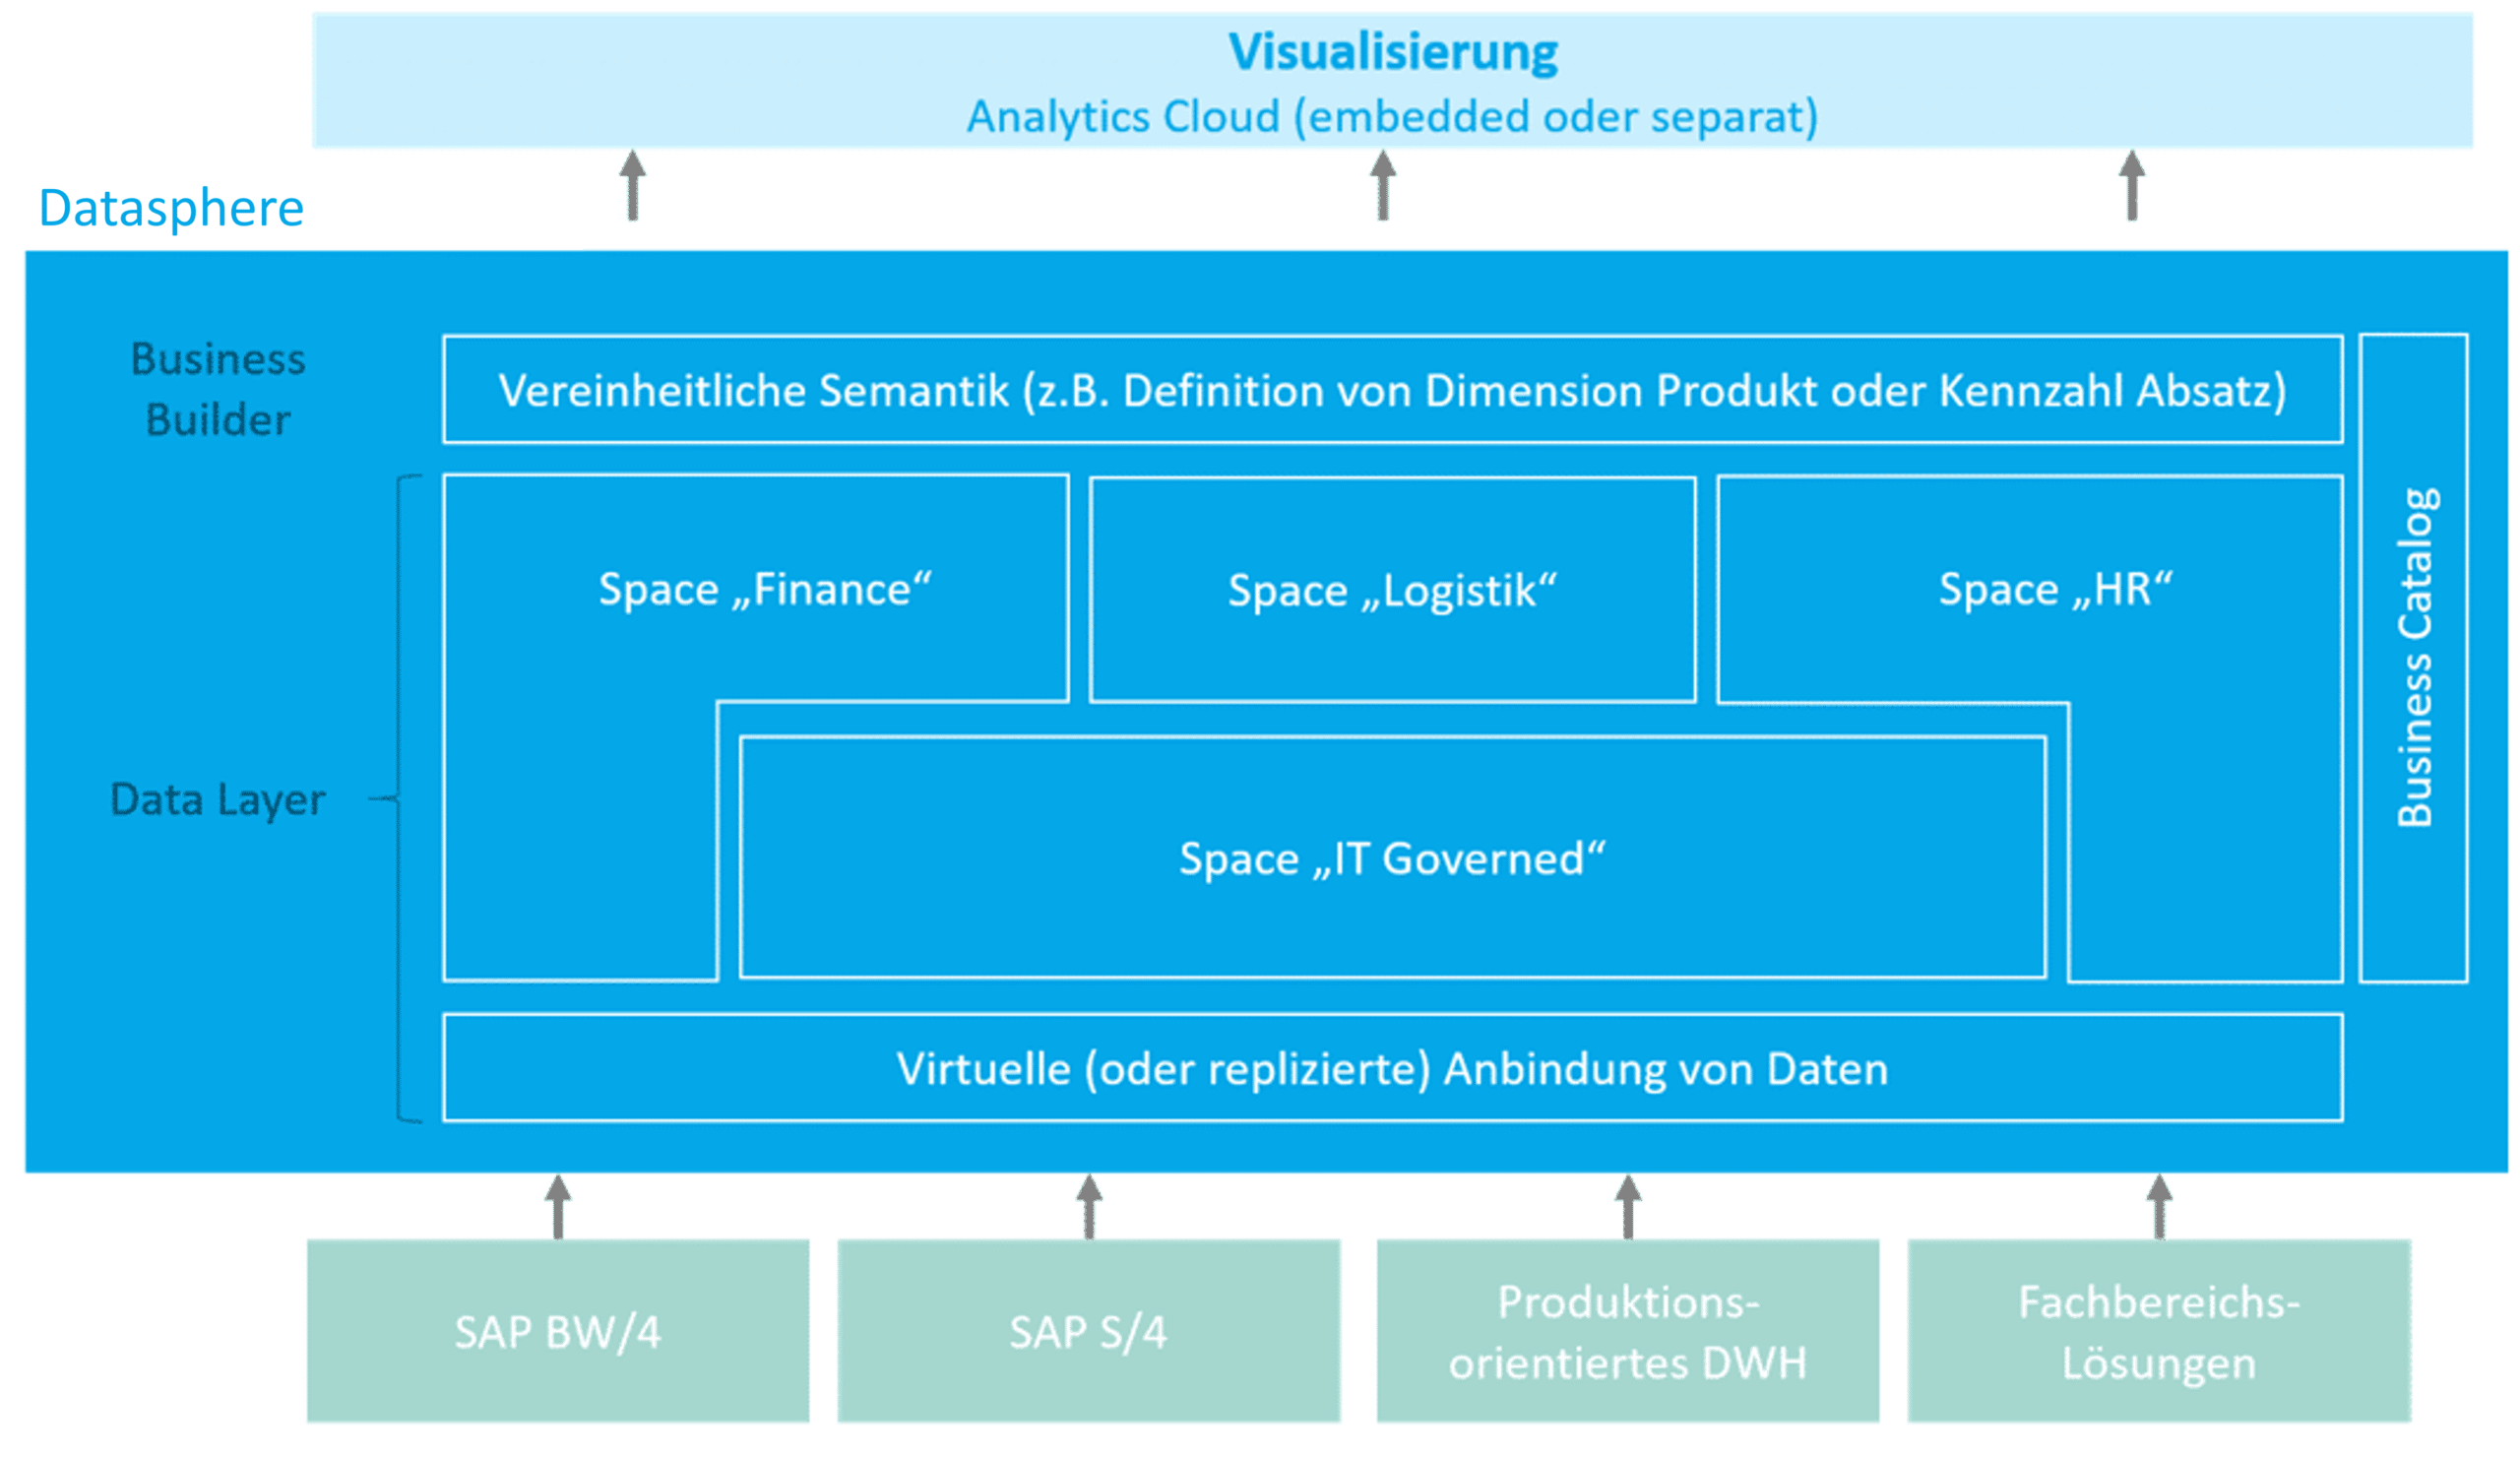
One of the main goals of Business Builder is to decouple semantics and data models. If changes are made to the underlying data model at a later date, these can be quickly and easily transferred to the semantic layer (e.g., use of a different source field). The data sources can come from both SAP and non-SAP systems. The Datasphere can create a uniform virtual business view across multiple source systems and thus serves as a virtualization (business) layer.
Fig. 5: Virtualization | isr.de
In addition to a simple description of semantics, there is still potential for expanding the functionality of the Business Builder. One example of this is the mapping of more complex relationships between objects in the data layer when defining business entities. If, for example, multiple data objects in the data layer can be easily linked (joins), it would be very simple to build a dimension from multiple source tables in the data layer. Currently, this must primarily be prepared in the data layer.
We will continue to follow developments and are eagerly awaiting the upcoming releases.
Since 1993, we have been operating as IT consultants for Data Analytics and Document Logistics, focusing on data management and process automation. We provide comprehensive support, from strategic IT consulting to specific implementations and solutions, all the way to IT operations, within the framework of holistic Enterprise Information Management (EIM). ISR is part of the CENIT EIM Group.