WHY STANDARD MONITORING FOR SAP DATASPHERE IS INSUFFICIENT AND CUSTOMIZED SOLUTIONS ARE BECOMING ESSENTIAL.
SAP Datasphere empowers users to construct data models with remarkable simplicity, establishing itself as the premier self-service solution. However, this potential is often hampered by resource-intensive queries that can bring the entire SAP Datasphere to a halt. Have you perhaps encountered similar challenges?
To ensure user satisfaction and demonstrate the full potential of SAP Datasphere, we recommend pursuing two key approaches:
One approach is to optimize the efficiency of system resources.
Another crucial approach involves comprehensive and tightly integrated monitoring. Recognizing the limitations of SAP's standard monitoring functionalities in this area, we provide the ISR Health Monitoring solution. Our system meticulously monitors not only the accurate loading of rules but also a multitude of other key performance indicators to ensure robust system stability.
Before we elaborate on ISR's monitoring approach, we must address a few fundamental questions:
Which Key Performance Indicators (KPIs) are Crucial?
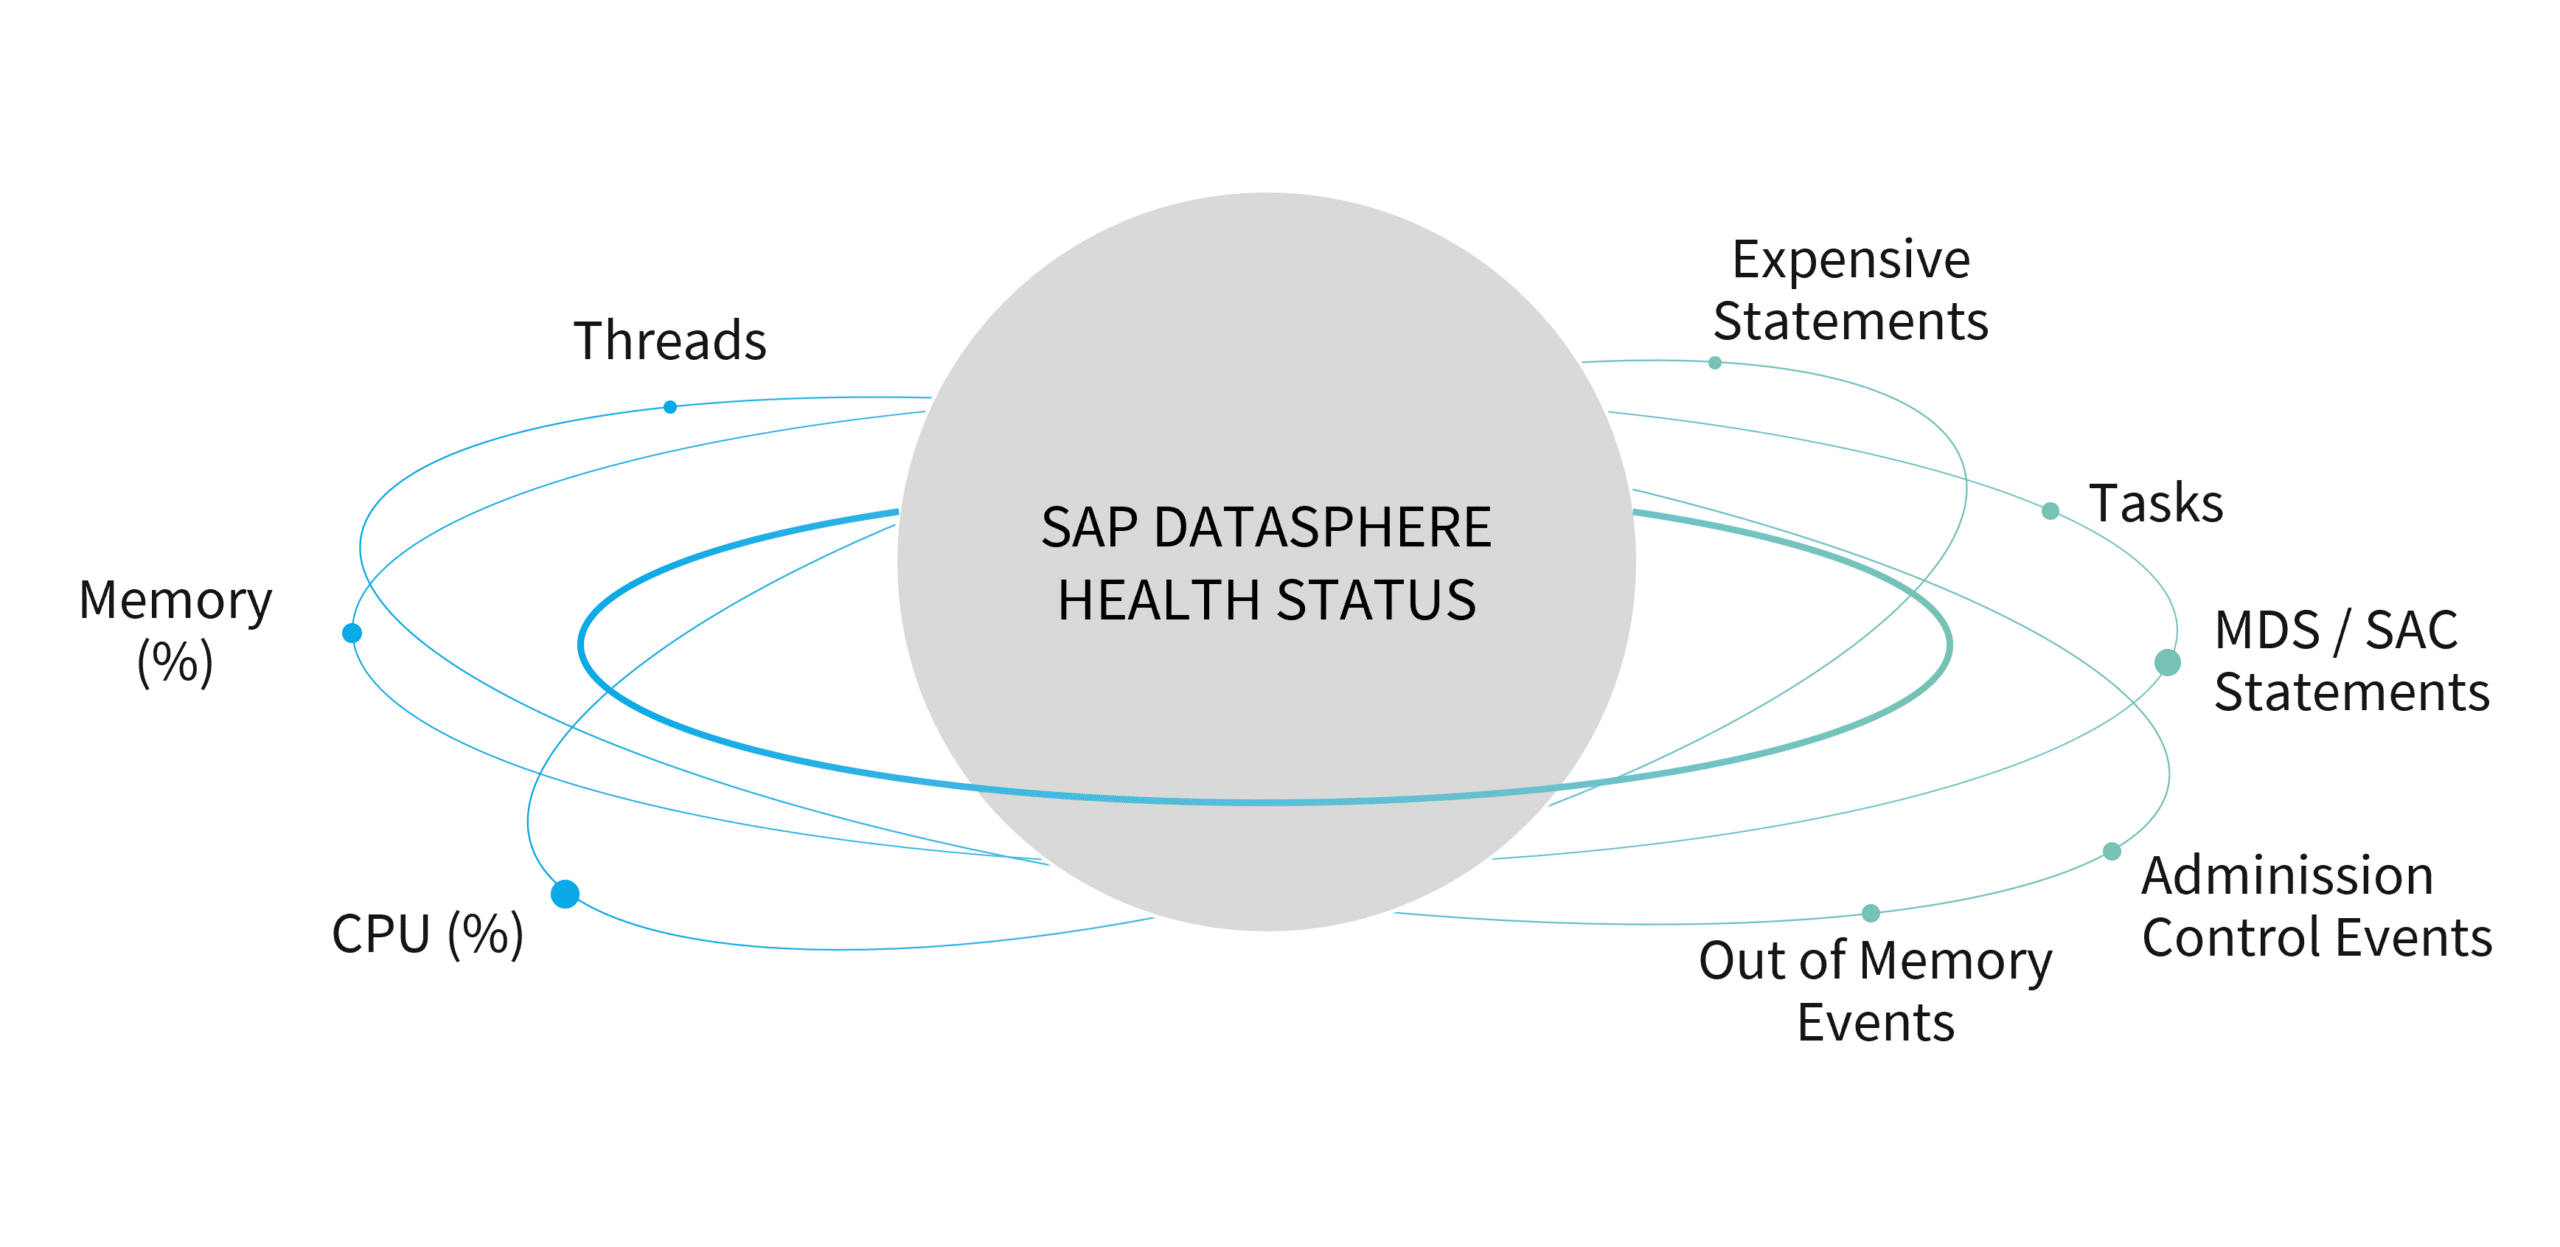
- Expensive Statements: Queries that consume an above-average amount of resources.
- MDS Statements via SAP Analytics Cloud (SAC) Queries: Queries transmitted from SAC to SAP Datasphere.
- Executed Tasks: Scheduled tasks performed within the system.
- Admission Control Events: Occurrences where queries are deferred or rejected due to elevated system utilization.
- Out of Memory Events: Incidents where the system lacks sufficient memory to execute a query or task.
What standard monitoring solution does SAP Datasphere provide?
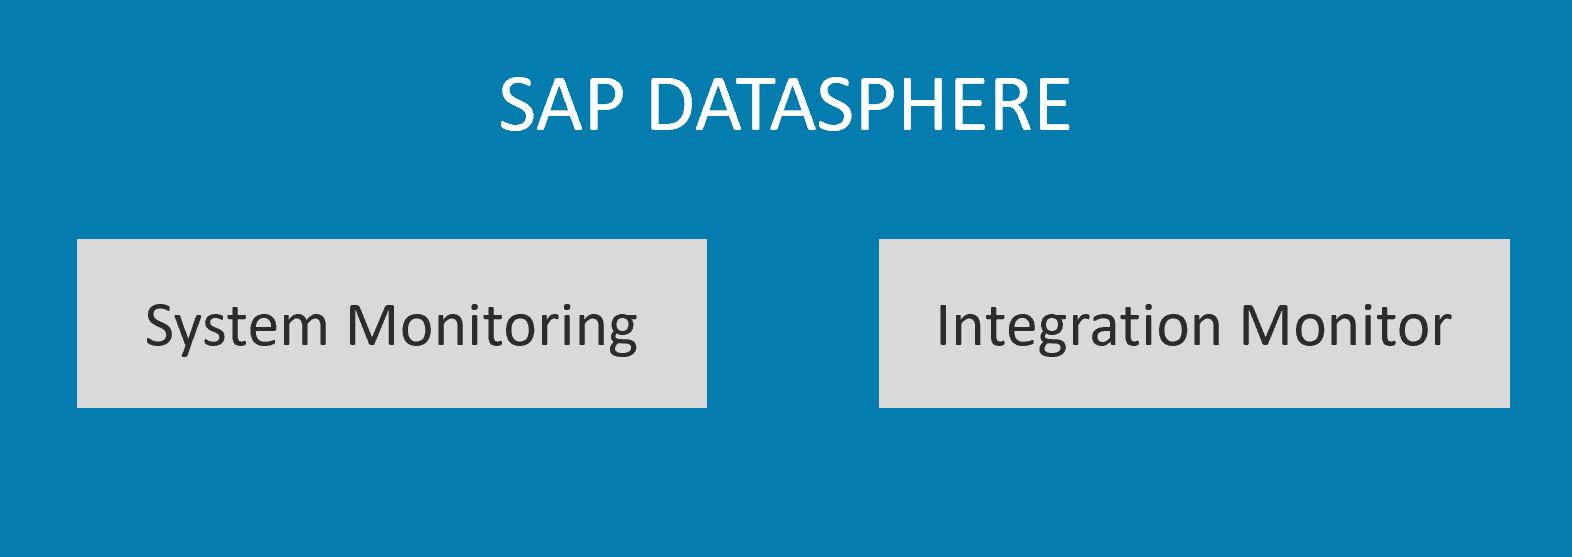
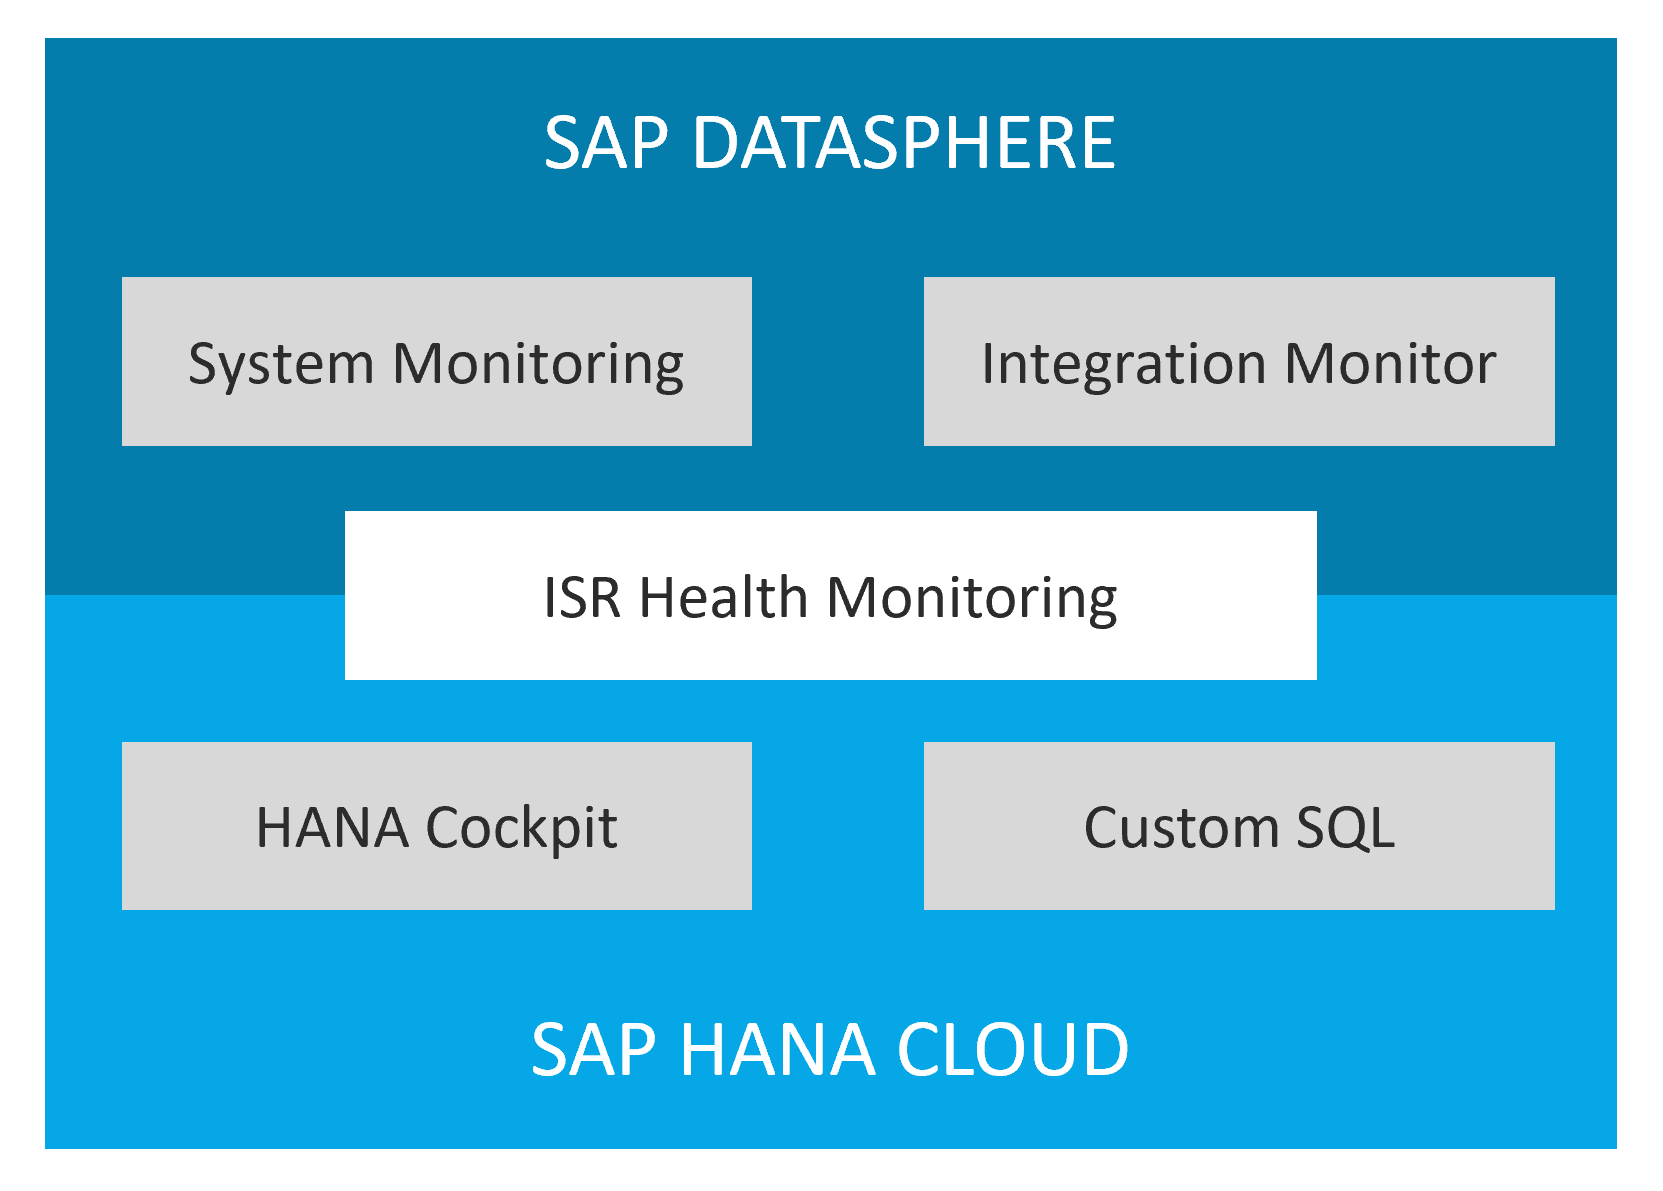
SAP Datasphere, through its System Monitor, provides a fundamental overview of specific system metrics.
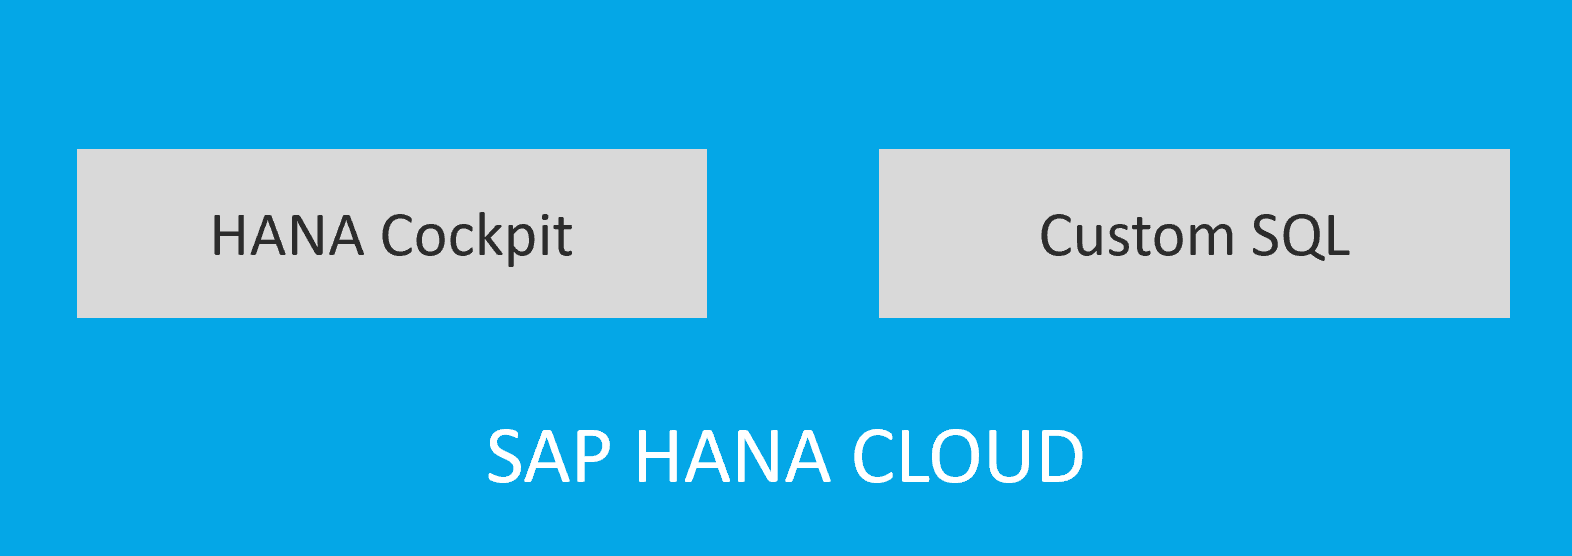
The HANA Cockpit also delivers key performance indicators such as CPU and memory utilization, alongside information regarding active threads and ongoing queries.
How can these key performance indicators be measured?
- CPU, Memory, and Threads: Via the HANA Cockpit or by utilizing a DB analysis user and custom SQL code that queries data from the M_LOAD_HISTORY_HOST and HOST_LOAD_HISTORY_HOST tables.
- Expensive Statements: By querying the M_EXPENSIVE_STATEMENTS table using custom SQL code.
- MDS Statements: Limited visibility is available through SAP Datasphere System Monitoring. For more detailed insights, the M_MULTIDIMENSIONAL_STATEMENTS and M_MULTIDIMENSIONAL_STATEMENT_STATISTICS tables can be leveraged.
- Task Management: Space-specific monitoring is available through the Integration Monitor. For a more comprehensive, cross-space analysis, it is necessary to execute custom SQL queries on the TASK_LOGS table using a DB analysis user.
What challenges arise when utilizing the standard monitoring solution?
SAP's standard tools offer only limited capabilities. Firstly, there isn't a single integrated standard solution, but rather a series of entry points including System Monitoring, Integration Monitoring, and the HANA Cockpit. Consequently, system administrators must always consider multiple entry points. Furthermore, the native tools have restricted functionality, making it, for instance, very difficult or even impossible to perform a root cause analysis (e.g., "What caused high CPU utilization this morning?"). Essential content (e.g., Expensive Statements) is simply absent. Custom SQL code is required for analysis, which can largely only be executed by a DB analysis user. Moreover, "Expensive Statements" are not historized, which complicates tracking and necessitates further custom solutions.
Ultimately, extensive technical knowledge is required to identify and optimize resource-intensive activities. This process resembles a complex puzzle that must be manually reassembled with considerable effort each time.
Effective monitoring of SAP Datasphere frequently necessitates individual customizations, as standard tools often fail to provide all requisite insights. This approach, however, results in increased effort and introduces the risk of errors. Consequently, there is an urgent demand for advanced, automated monitoring solutions that facilitate comprehensive and efficient oversight.
What does the ISR Monitoring Solution offer?
To address these challenges, ISR has developed two distinct solution offerings for its clients.

ISR Health Monitoring
For SAP Datasphere, we have developed an integrated and automated monitoring solution. Central to this is a Health Monitoring Cockpit, which visualizes the most critical KPIs within an SAP Analytics Cloud dashboard and facilitates comprehensive analyses.
ISR MONITORING COCKPIT
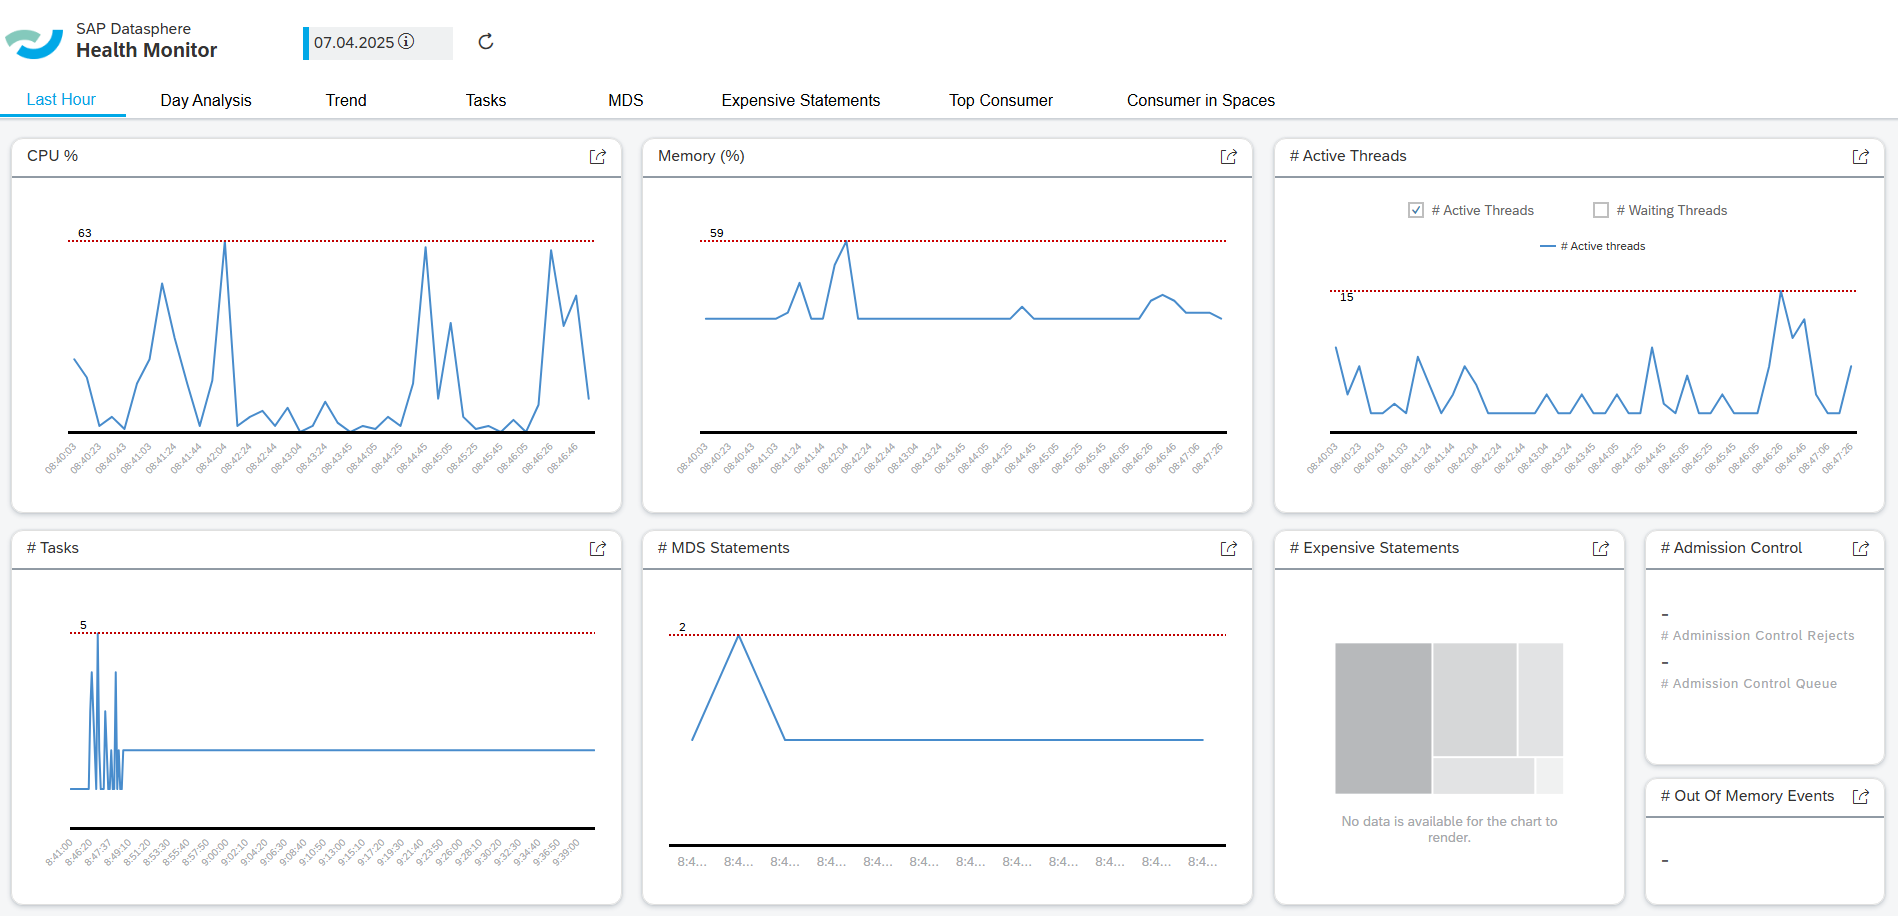
A consolidated view of all critical monitoring KPIs within a single dashboard, providing the capability to identify trends and conduct in-depth analyses. The reporting is underpinned by a standardized data model that interrelates all KPIs and their influencing factors.
- Easy-to-use Dashboard
- Integrated Analysis for all relevant KPIs &
- Deep-Dive Analyses at Statement Level
empty
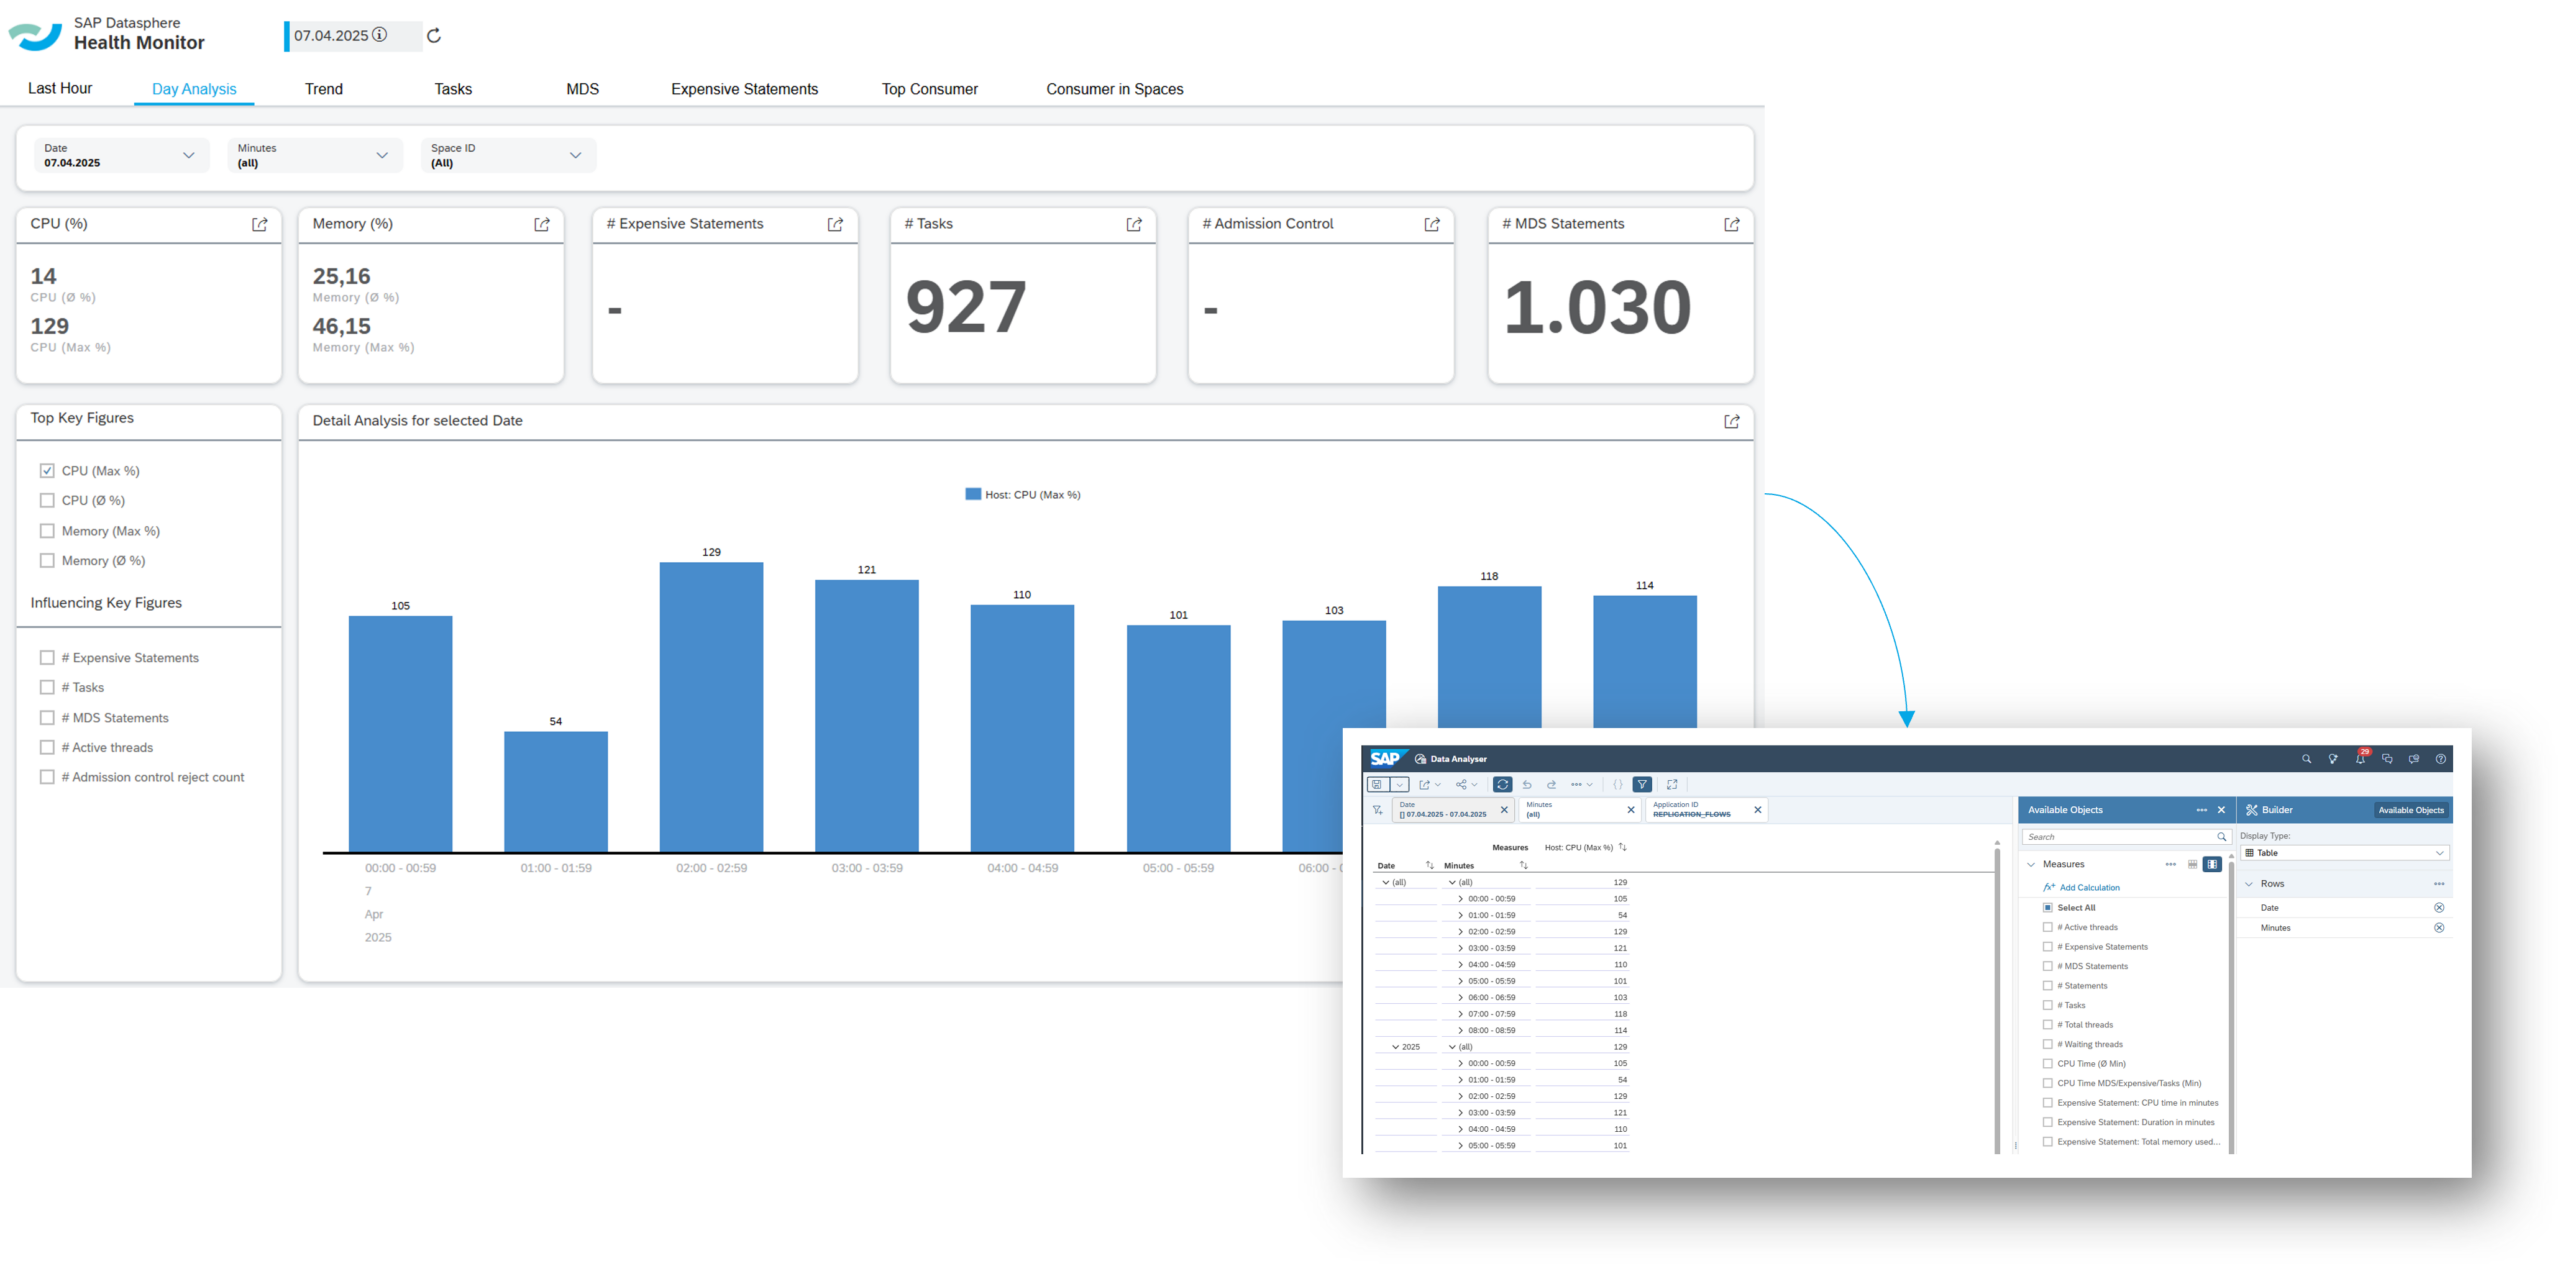
IDENTIFY ROOT CAUSES
empty
TREND ANALYSIS
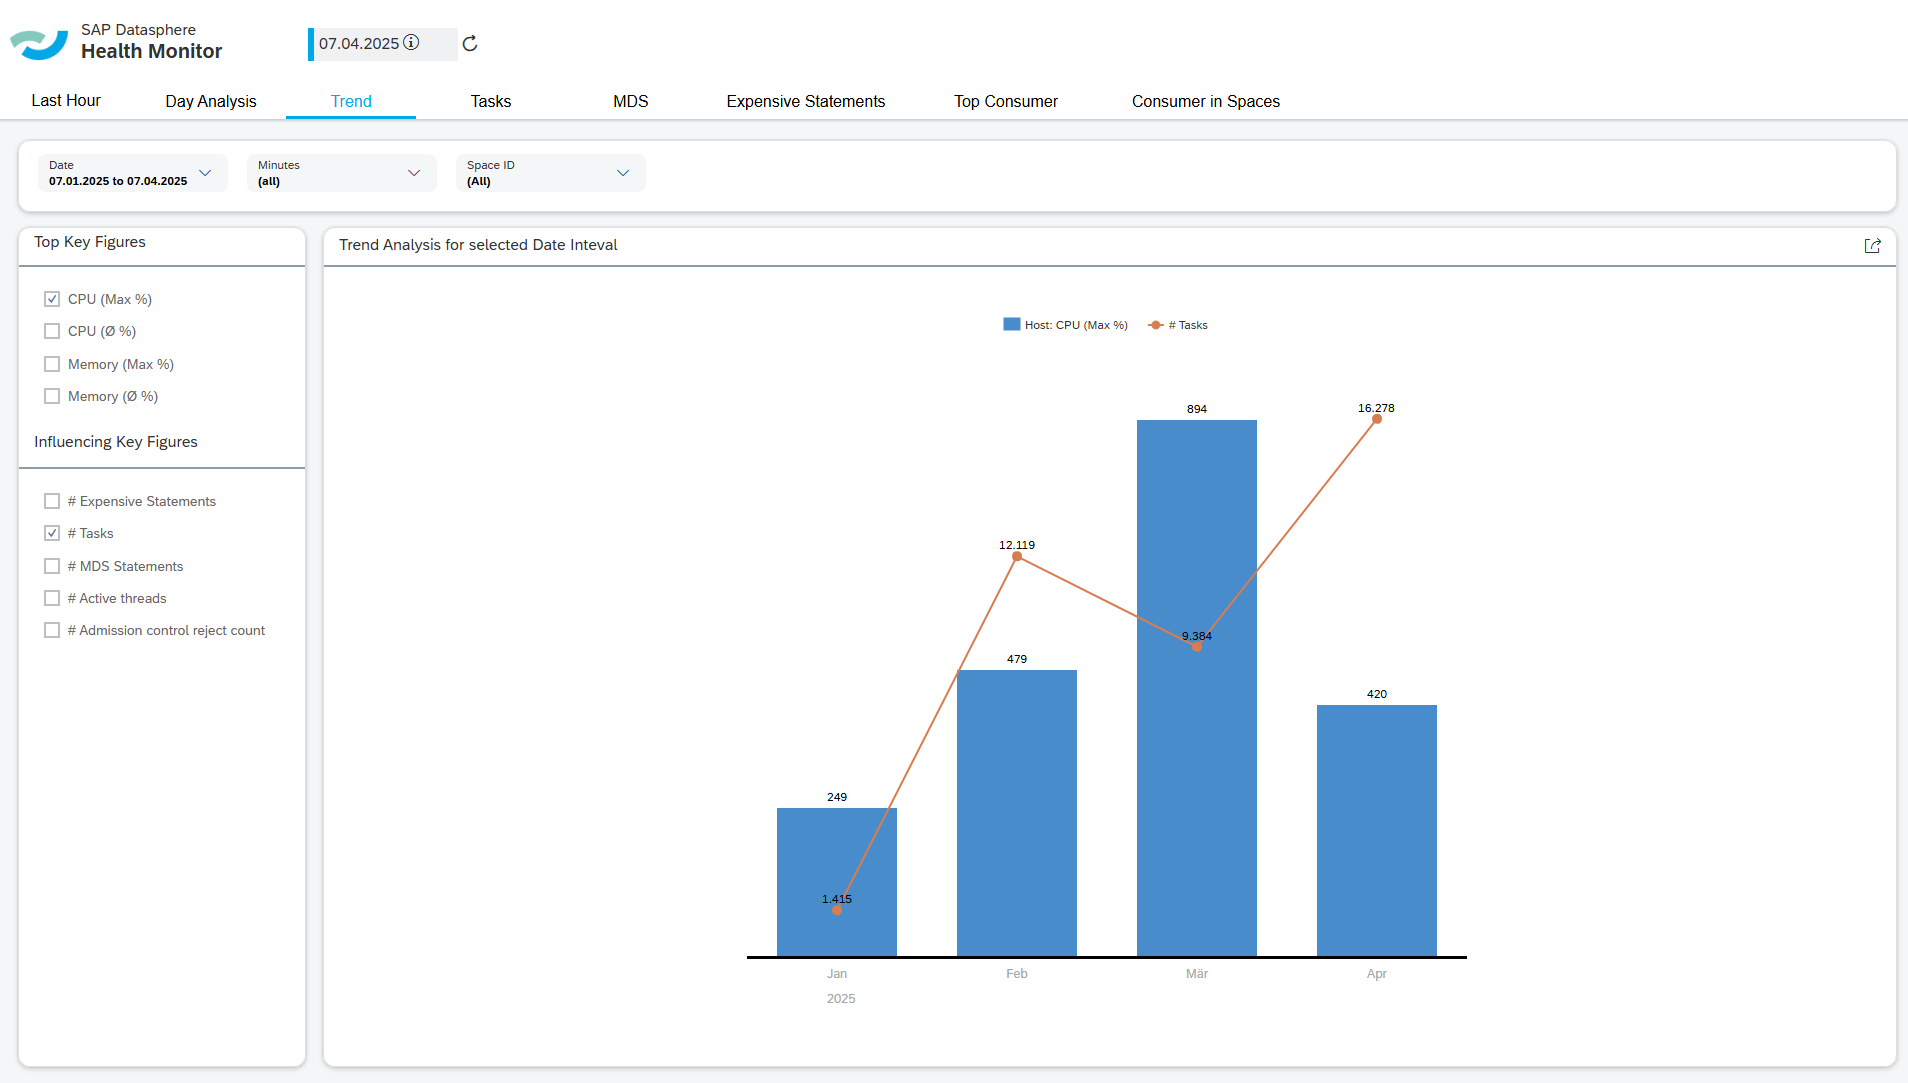
Continuously monitor the evolution of your environment: Our solution empowers you to identify long-term trends, such as the increase in memory consumption over time. You retain full control over the duration for which data history is stored within your model, ensuring complete flexibility and alignment with your specific requirements.
empty
TASK MANAGEMENT
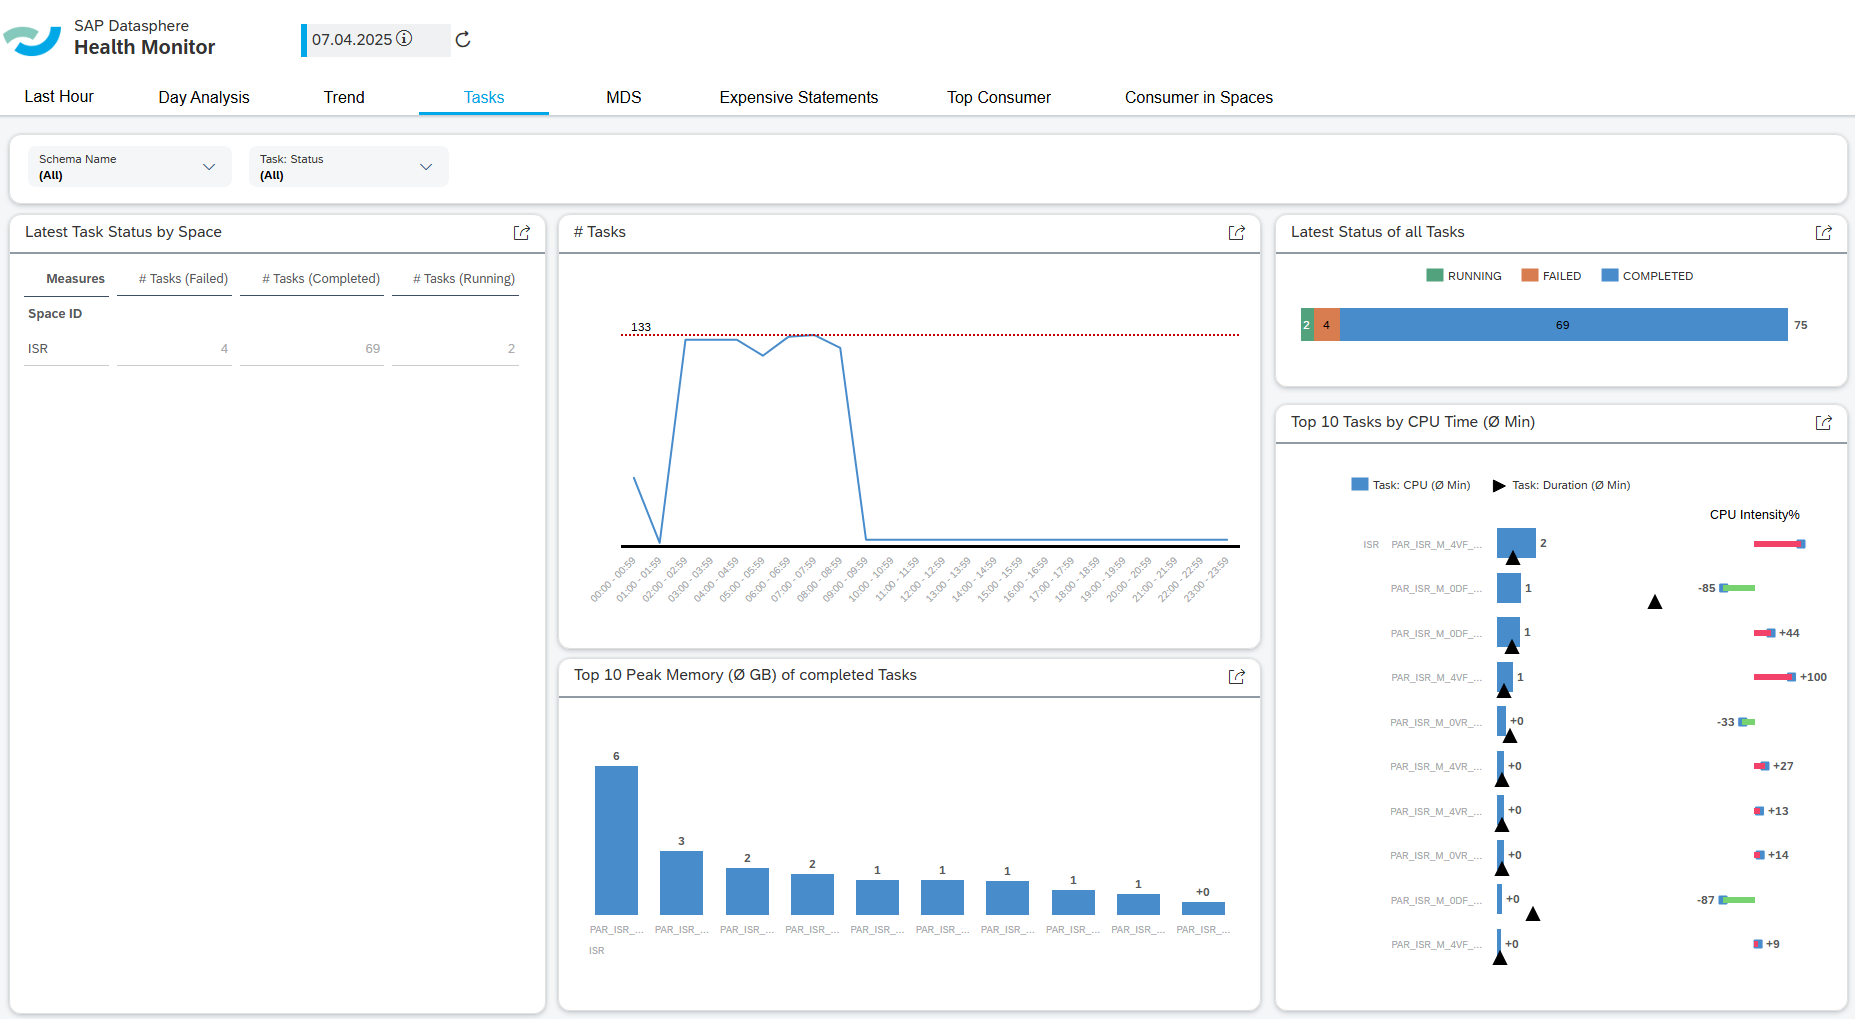
Obtain a comprehensive overview of all active tasks within the system. Swiftly identify the most resource-intensive operations concerning memory and CPU consumption. With intuitively designed access points, a detailed analysis is just a few clicks away, facilitating efficient and targeted performance monitoring.
empty
Keep an Eye on Resource Hogs – Quickly Identify Costly Objects
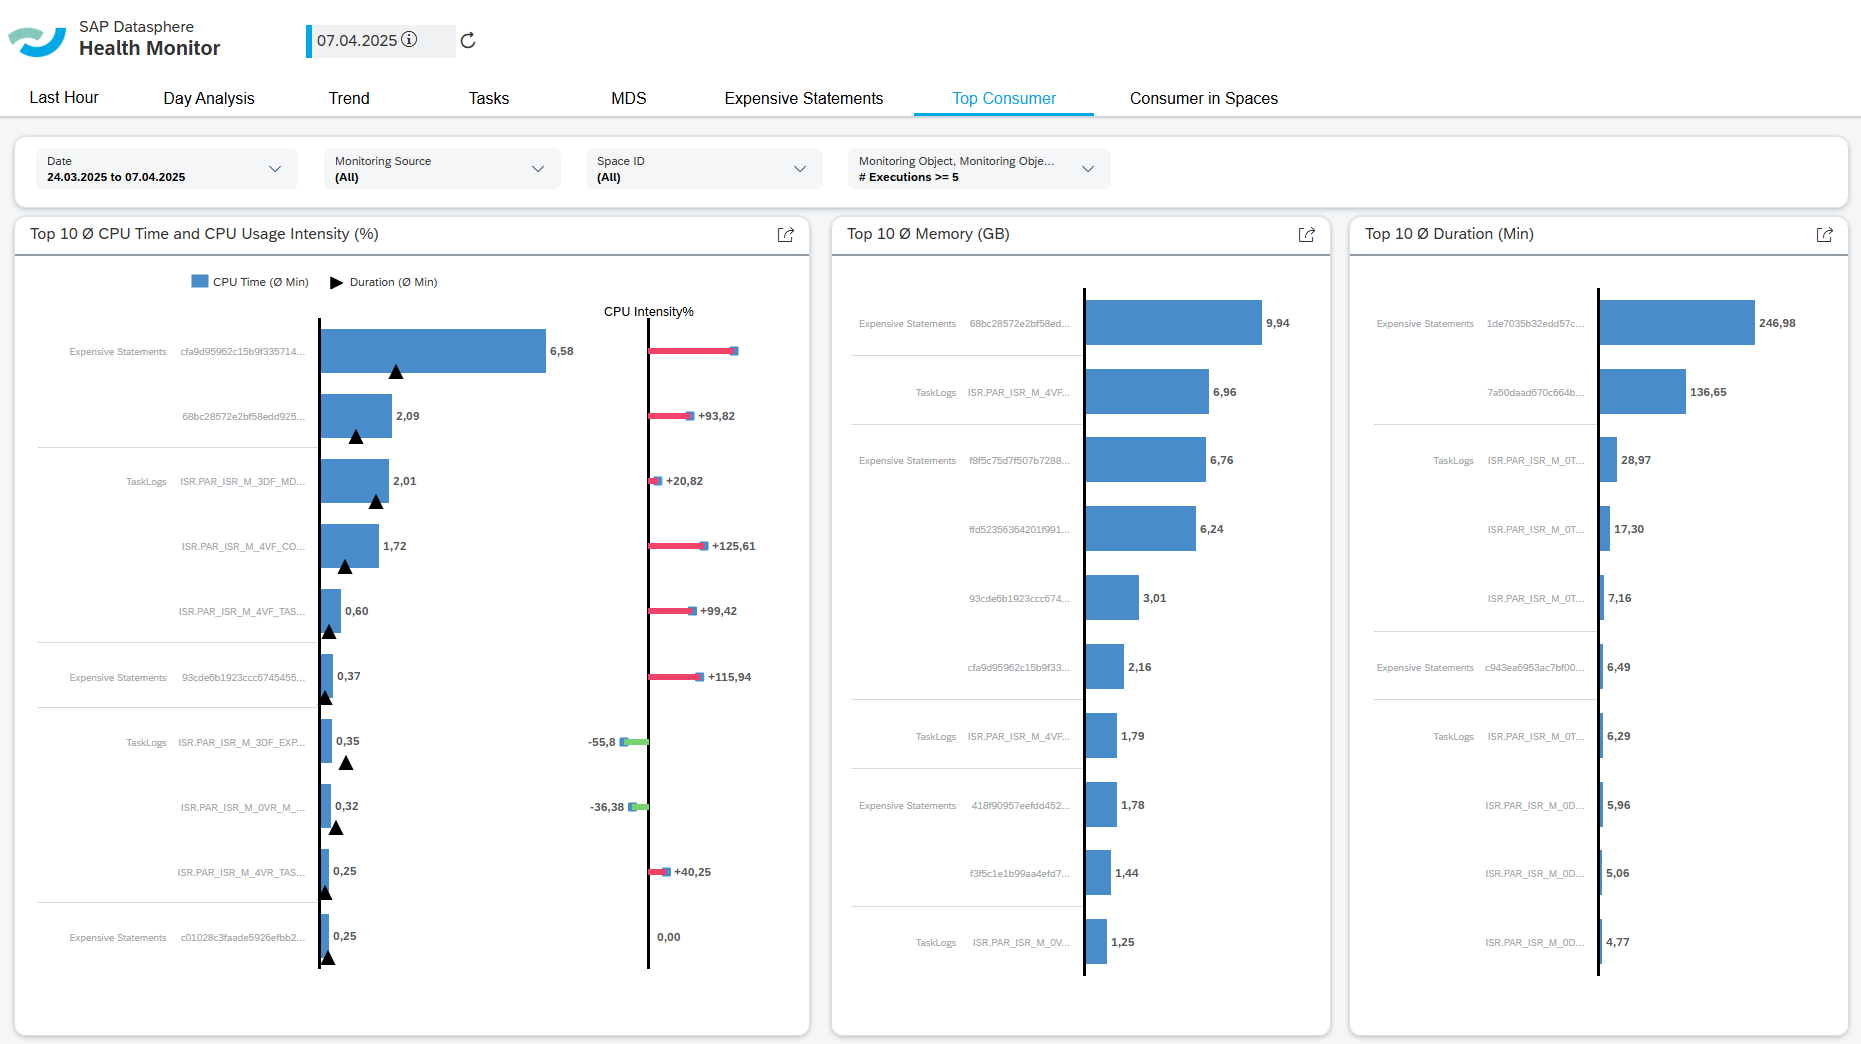
Our system automatically analyzes your environment and displays the most resource-intensive objects at a glance. This allows you to immediately identify which objects require optimization before they lead to excessive memory or CPU utilization. It is an effective tool for proactively preventing performance issues.
empty
Webinar
Efficient Health Monitoring for SAP Datasphere
The stability of SAP Datasphere is crucial for widespread business acceptance. However, system monitoring often entails significant manual effort due to the absence of integrated and automated analysis tools. Factors such as CPU load, memory consumption, and system utilization substantially impact performance and necessitate targeted oversight. In this webinar, we will demonstrate how the ISR standard solution for Health Monitoring facilitates transparent and efficient system control.
ISR Health Check
- System Load Overview
- Identification of Resource-Intensive Processes and Objects
- Proposed System Optimizations
What benefits do ISR's solutions provide?
What benefits do ISR's solutions provide?
Our monitoring solution is an integrated, automated system that offers numerous advantages:
Significant Reduction in Complexity
Our monitoring data model incorporates extensive SQL logic (e.g., parsing JSON MDS statements, linking with CPU utilization) and standardizations (e.g., unifying CPU metrics) to reduce complexity for users. This significantly contributes to abstracting complexity for users of our data model and cockpit.
Reduced Manual Effort
Comprehensive monitoring of SAP Datasphere typically involves significant manual effort, requiring the examination of various UI screens (e.g., HANA Cockpit) and the execution of custom SQL scripts for analyses. The ISR monitoring solution substantially reduces these manual efforts by automating tasks such as the identification of resource-intensive objects.
Central Monitoring Cockpit
A central cockpit is available for monitoring SAP Datasphere, consolidating the most critical information. The space is permission-relevant, enabling decentralized utilization of our cockpit, for example, by specific departments within self-service architectures. If resource-intensive objects are identified, a deeper analysis, down to the individual SQL statement, can be performed using the Data Analyzer in SAP Analytics Cloud.
Integrated View of KPIs and Influencing Factors
A connection is established between central platform key figures (e.g., CPU utilization) and influencing factors (e.g., Executed Tasks, MDS/SAC Requests, and Expensive Statements). This facilitates the rapid identification of resource-intensive developments and provides insights for the ongoing optimization of data models and SAC stories.
Interested? Contact us!
Monitoring SAP Datasphere systems plays a crucial role in ensuring system stability and user acceptance. SAP's standard capabilities are limited and do not allow for comprehensive monitoring. The ISR Health Monitoring offers a solution to bridge this gap and provide customers with an integrated standard solution.
Your Point of Contact

Carl Stegat
Professional Business Development
SAP Information Management
carl.stegat@isr.de
+49 (0) 15142205480