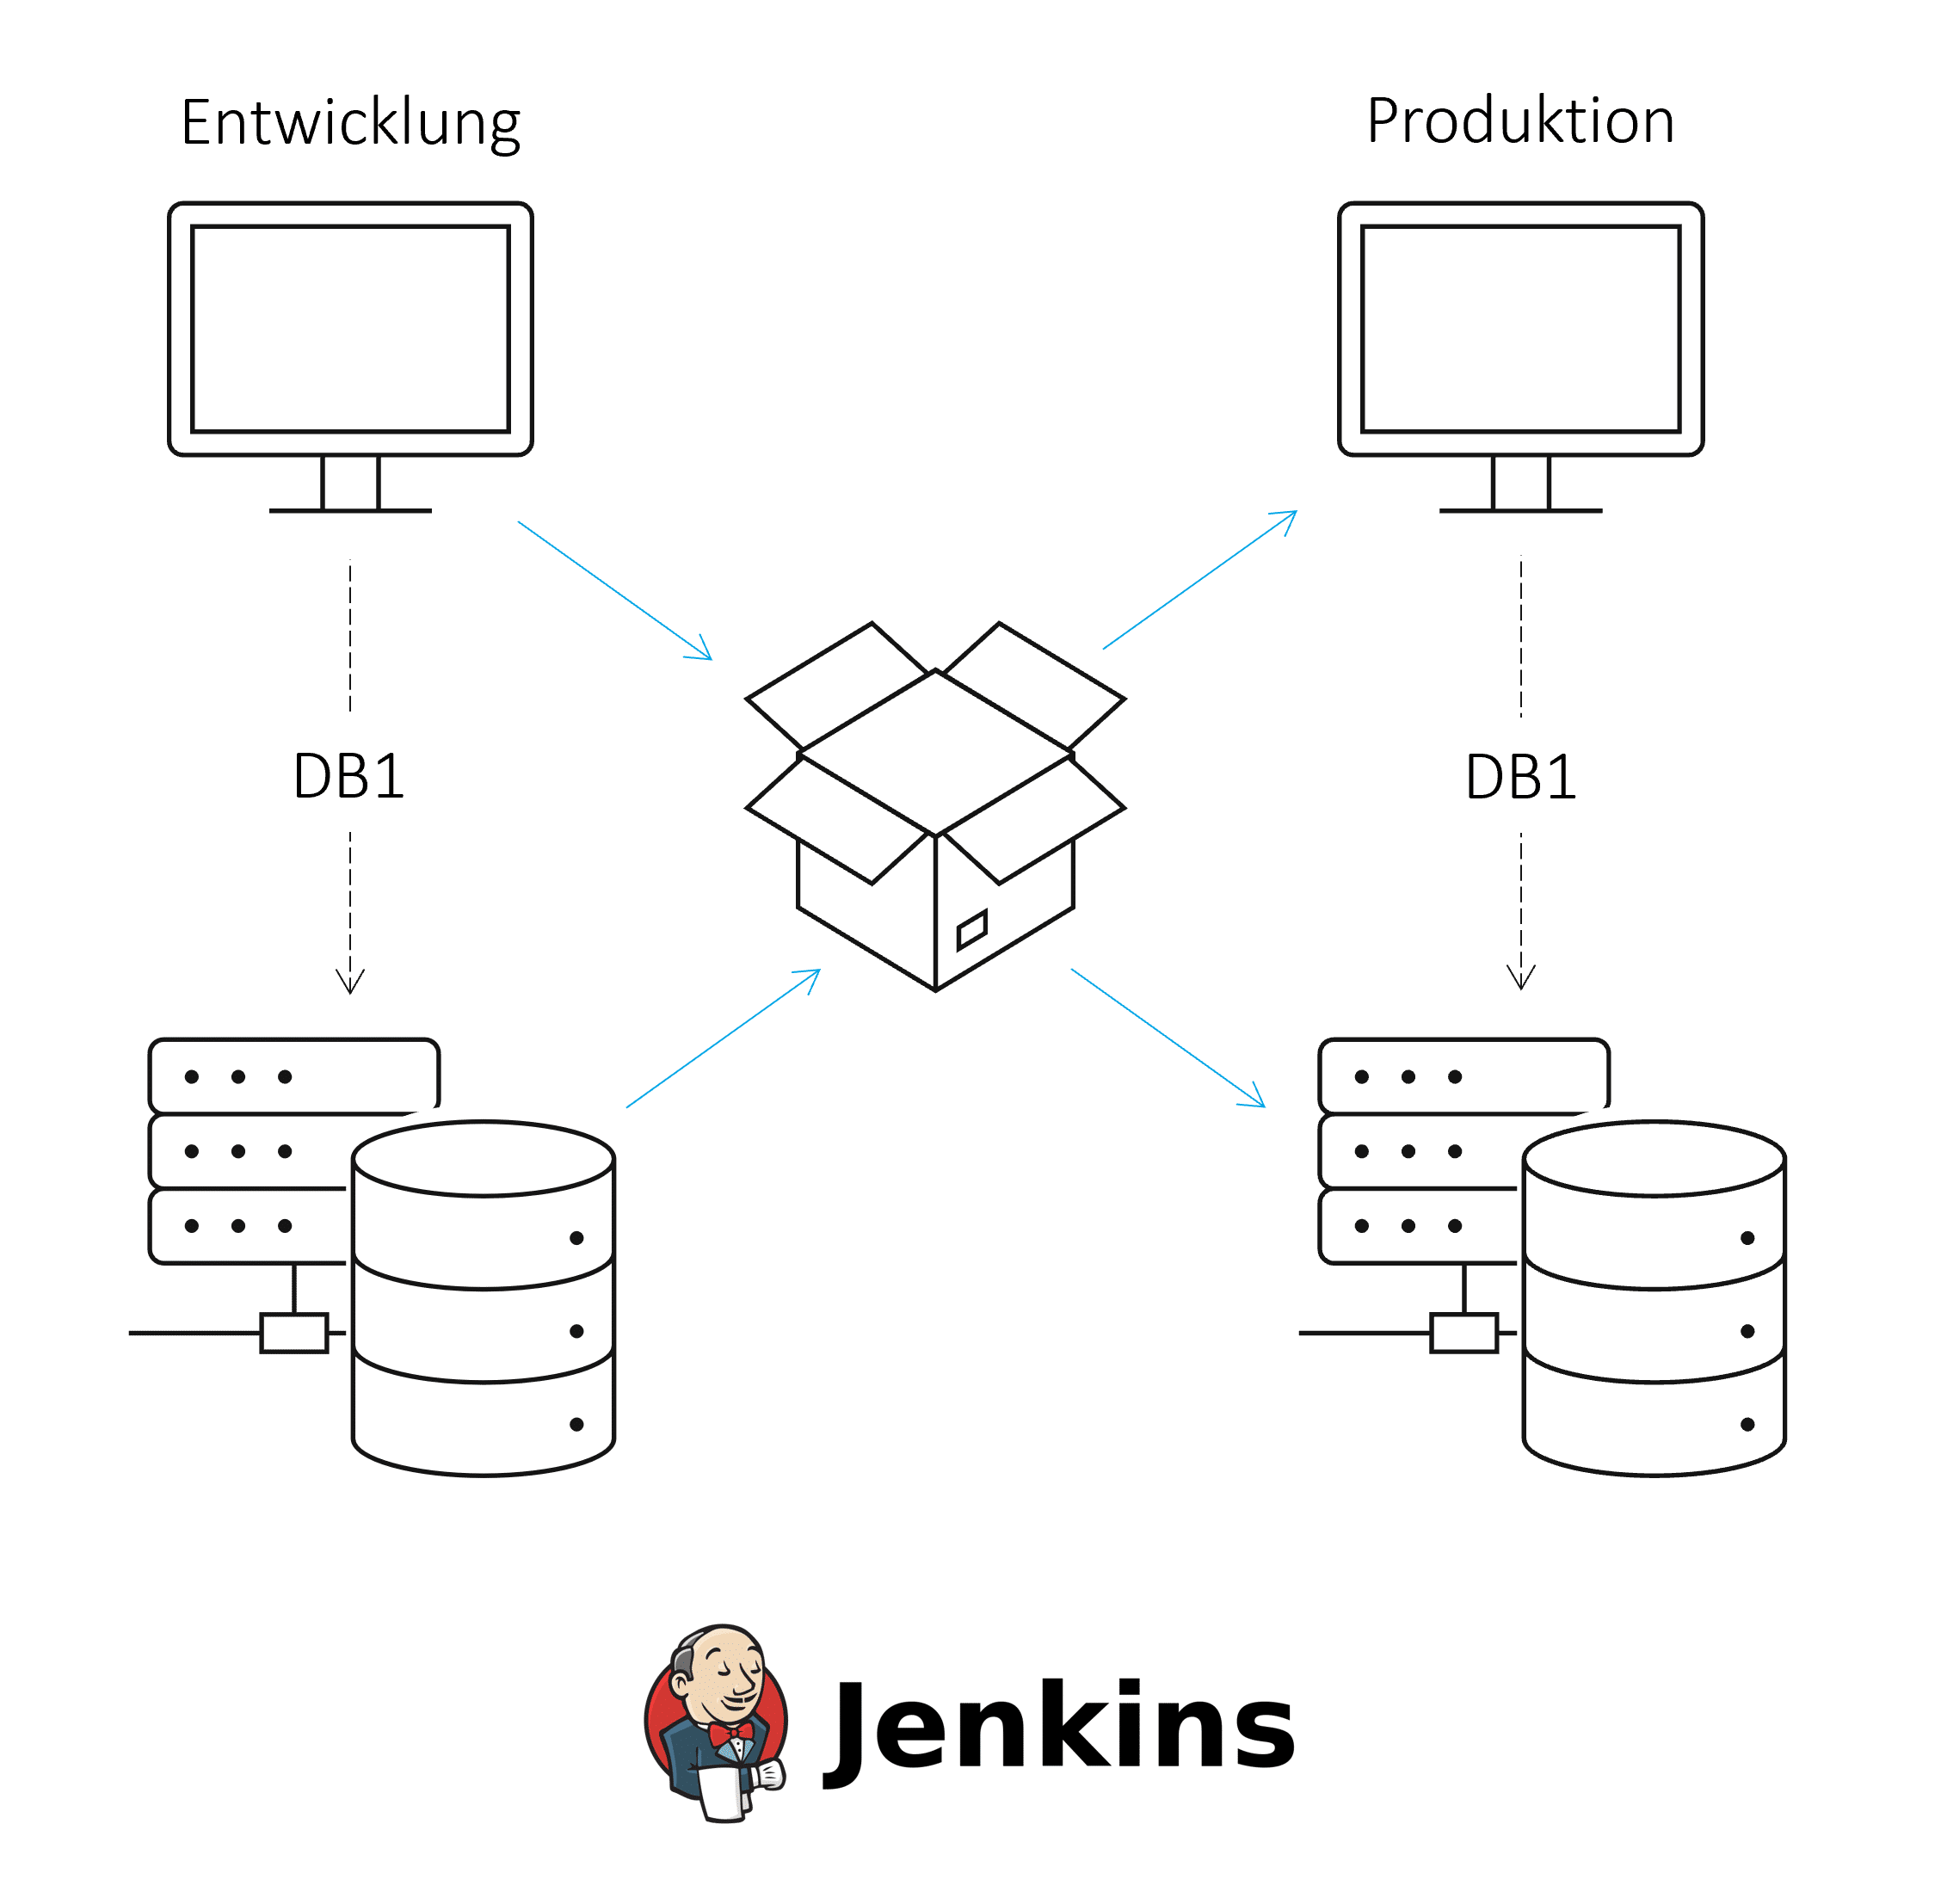
A reporting solution consists of at least one database and one reporting tool in both a development and production environment in its basic configuration. This allows changes to be made efficiently and securely for end users.
Data models and dashboards must be exchanged between these environments in a regulated process, whereby certain data models and dashboards that are under development should not be viewed in the production environment.
We provide an initial overview of the challenges that need to be addressed when deploying data models and artifacts from a front-end reporting tool. We also walk through the steps involved in setting up a regulated deployment process using a concrete example with an SAP HANA database and Apache Superset.
Our scenario
In this blog article, we would like to look at the implementation of a multi-system landscape for displaying dashboards and charts based on an SAP HANA data model. The article is based on a two-system landscape, each with a HANA database and a front-end server in a development and production environment. In this specific case, however, more servers and a test environment can also be used.
A modern, automated, and monitored continuous integration and continuous delivery (CI/CD) process should be developed to ensure a regulated deployment process between environments. Continuous integration involves regularly merging and testing software components or changes. Continuous delivery allows software to be deployed into production. CI/CD can improve software quality and minimize the time it takes to deploy changes.
CI/CD processes are based on tools for version control, automatic builds, and managing the resulting artifacts. For more information on CI/CD with HANA, see this ISR blog article.
Challenges of this multi-system landscape
Several challenges must be considered during implementation:
Challenge 01: Loading dashboards into the repository
A prerequisite for transporting dashboards to the repository is that they are available in file form. All information necessary for defining the object should be included in a file. This may include the elements of the dashboard with data source and placement, the name, or even the creation date. This ensures that each dashboard can be created in other environments based on this file.
Challenge 02: Aligning the source names in the database
In a landscape with at least a development and production environment, the file source names in the front-end systems must be compared, as the correct database system must be accessed in each case.
If the source names of the databases differ, they must be adjusted during transport to the production environment (e.g., via the sed command in Linux). The disadvantage of this solution is that, first, all locations in the files that reference the database must be identified. These locations can change dynamically based on the content and structure of a dashboard. Second, an automated approach is prone to errors, as locations are replaced where this is not actually desired.
On the other hand, if the source names are identical, the files do not need to be modified, but this makes it more difficult to distinguish between the data sources in the development and production environments.
Challenge 03: Transporting the data model (see ISR article)
When transporting data models from the HANA platform, it is advantageous to distinguish between design-time objects and runtime objects for database objects. This makes it possible, for example, to create calculation views in the Web IDE as usual and to control deployment manually in scripts.
Challenge 04: Taking into account dependencies between dashboard versions and data models
There are two ways to fulfill the dependencies between the files for the dashboards and the data models. In Git, a folder can be created for dashboards and data models respectively. Alternatively, the files can be stored together in an artifact repository. It is important to keep track of the versions of the deployed data models and dashboards so that errors in the transport process or in production can be quickly resolved.
CI/CD using a real-world example with HANA databases and Apache Superset
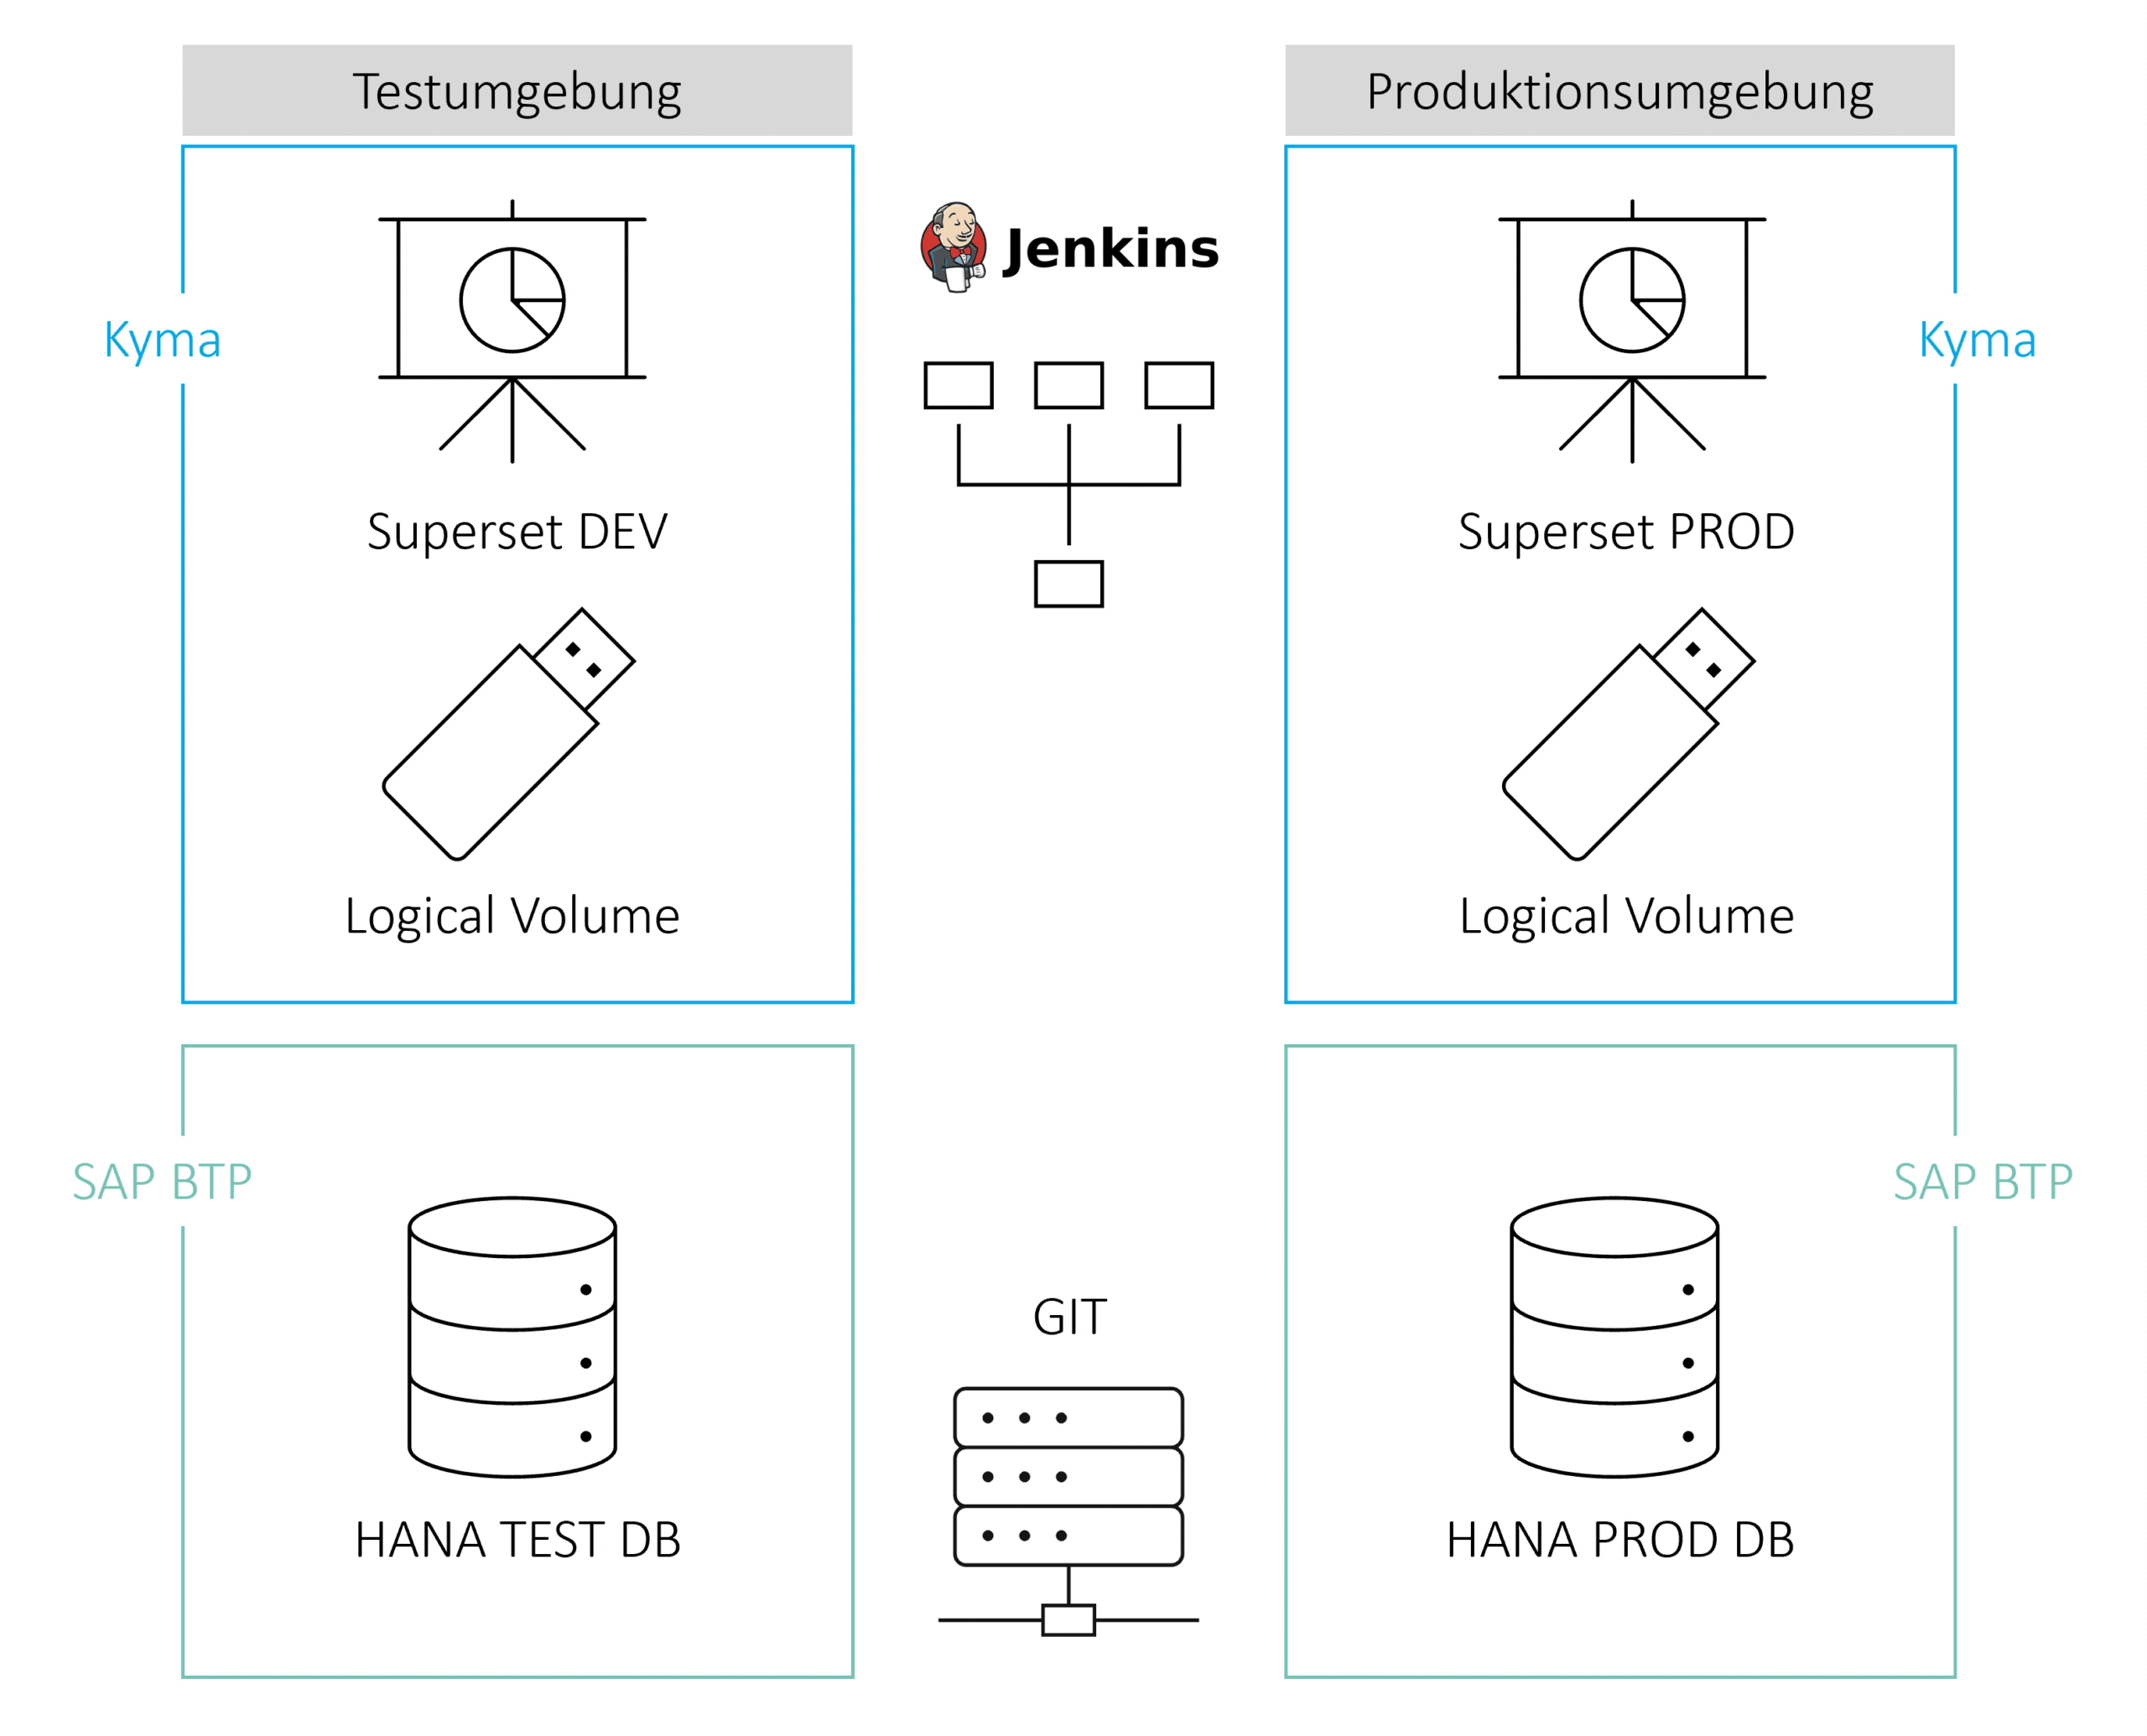
The architecture consists of a development and production environment with a HANA database in SAP BTP and an Apache Superset instance in the Kyma environment. Apache Superset is used as a front-end tool for visualizing data and consists of dashboards, charts, datasets, and stored data sources. These artifacts are stored in a logical volume in the Kyma environment and can be manually downloaded and uploaded as zip-packed Yaml files.
Bitbucket is used as a repository for Superset files and HANA data structures. Jenkins accesses the data in the repository and handles automated build and deployment to the production environment.
The following process steps must be completed:
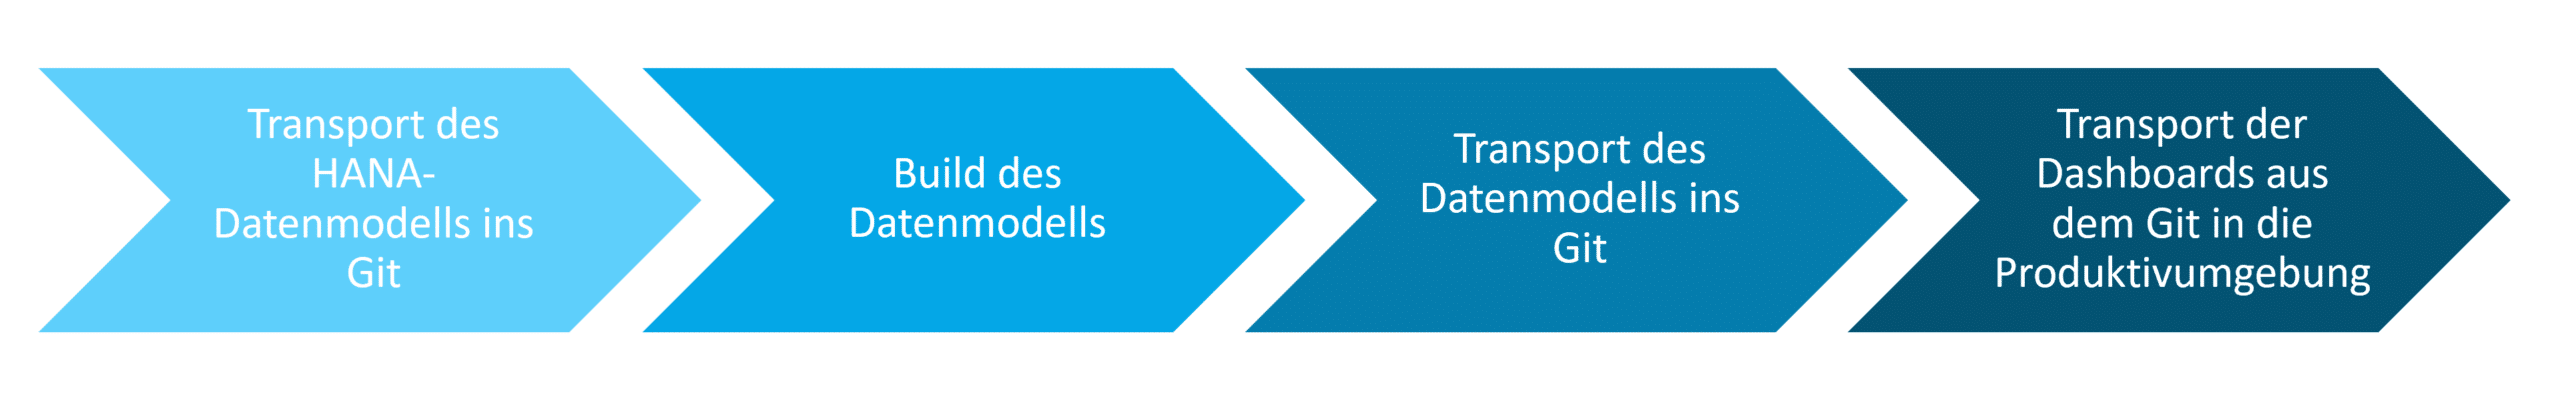

Step 1: Transporting the HANA data model to Git
Since the HANA data model is developed within Business Application Studio, there are several ways to transfer the model to Git. Within the GUI, you can push the files to a repository using the Source Control icon in the Activity Bar or, alternatively, perform these steps in a terminal window. For more information, see the SAP documentation on Business Application Studio.
Step 2: Build the data model
If the code for the data model is to be moved to the production environment, it makes sense to create a container for deployment. First, Jenkins must transfer the data from GIT to the container. In this environment, all steps for deploying multi-target applications are automated and encapsulated one after the other with the help of Jenkins.
Step 3: Transporting the dashboards to Git
There are three ways to transfer Superset dashboards to the repository, each with its own advantages and disadvantages.
- Manual export of specific dashboards in the Superset GUI: The result is a zip file consisting of the charts, the underlying data sets and databases, and metadata as Yaml files. These files can be pushed to Bitbucket.
Advantage: Precise control over which dashboards are to be exported
Disadvantage: Comparatively high manual effort - Export all dashboards in the Superset container using the command 'superset export-dashboards': The result is the same zip file, but in this case it contains all dashboards. This zip file can also be pushed to Bitbucket. In this step, all dashboards (including dashboards in development) are deployed to the production environment, but within the environment, access permissions can still be used to control whether users are allowed to access a dashboard at all.
Advantage: Steps can be automated using Jenkins and a container.
Disadvantage: Mandatory login and export of files from the container. - Export all dashboards via Superset REST API:Exporting via the REST API is similar to the 'superset export-dashboards' command, but does not require logging into the container.
Advantage: Steps can be automated using Jenkins and a container.
Step 4: Transporting the dashboards from Git to the production environment
As with exporting dashboards from Superset, there are three options for importing, each with the same advantages and disadvantages.
- Manual import of specific dashboards in the Superset GUI: A zip file is imported, consisting of the charts, the underlying data sets and databases, and metadata as Yaml files.
Advantage: Precise control over which dashboards are to be imported
Disadvantage: Comparatively high manual effort - Import all dashboards in the Superset container using the 'superset import-dashboards' command: A zip file with the same structure is imported, but in this case it contains all dashboards. Although this step deploys all dashboards (including dashboards in development) to the production environment, access permissions within the environment can still be used to control whether users are allowed to access a dashboard.
Advantage: Steps can be automated using Jenkins and a container.
Disadvantage: Mandatory login and import of files from the container. - Import all dashboards via Superset REST API: Importing via the REST API is similar to the 'superset import-dashboards' command, but does not require logging into the container.
Advantage: Steps can be automated using Jenkins and a container.
Conclusion
Several challenges must be overcome to ensure a regulated CI/CD process for dashboards and data models from a development environment to a production environment. These include both the individual transport of data models and dashboards and the consideration of dependencies between the two parts. This requires tools for versioning (such as Git) and automation (such as Jenkins).
In the specific example with Apache Superset and the HANA DB, there are several options for the individual transports, which are characterized, among other things, by the degree of automation and customization. This means that you can implement the process steps individually based on your own requirements.
Author: Tristan Beger

CONTACT
Bernd Themann
Managing Consultant
SAP Information Management