Datasphere is the latest data warehouse product from SAP. As a software-as-a-service solution, it is based on the new HANA Cloud Services. In the long term, Datasphere should be able to map a full-fledged enterprise data warehouse in addition to a self-service data preparation use case (see also Datasphere – Overview). As a data warehouse solution, Datasphere must be able to integrate as many sources as possible. In this article, we would like to provide an initial insight into Datasphere's data modeling using a simple example.
Our scenario
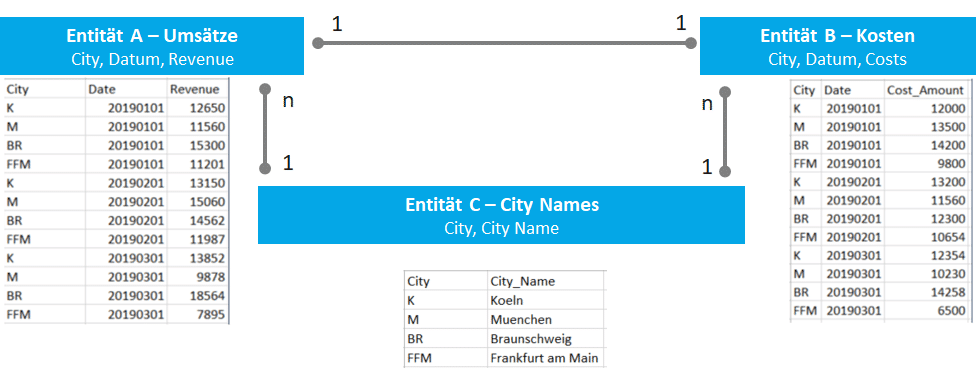
In our very simple scenario, we have two tables with transaction data containing sales and costs per retail area (in this case, simply a city). The retail team wants a clear overview of how much profit is generated per time period in a specific city. For simplicity's sake, we use CSV files as the data source with the following structure:
Building a data model in the Datasphere
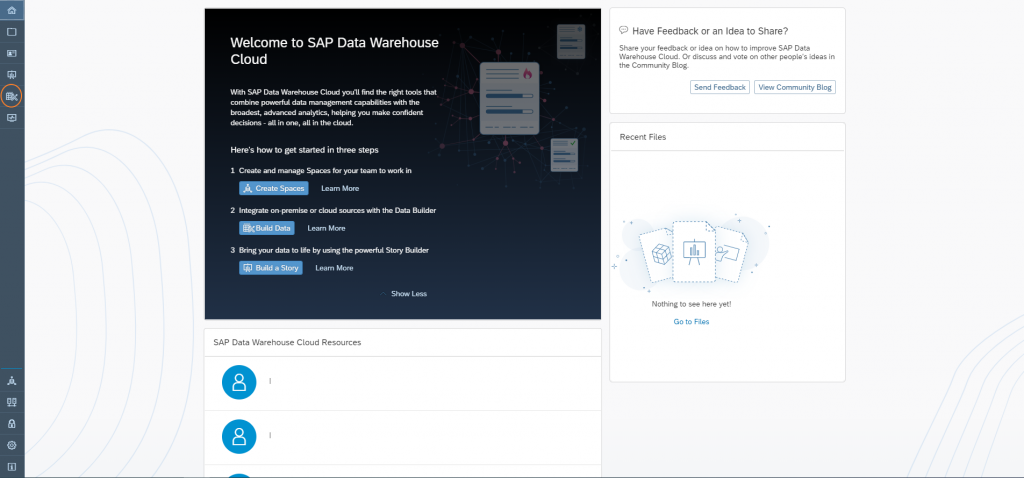
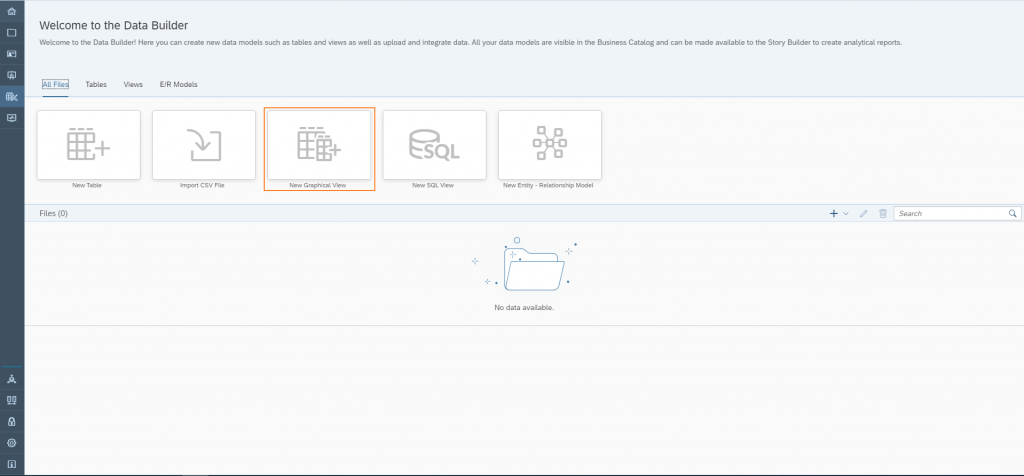
To access the user interface on which the view is to be built, you must first navigate to the Data Builder.
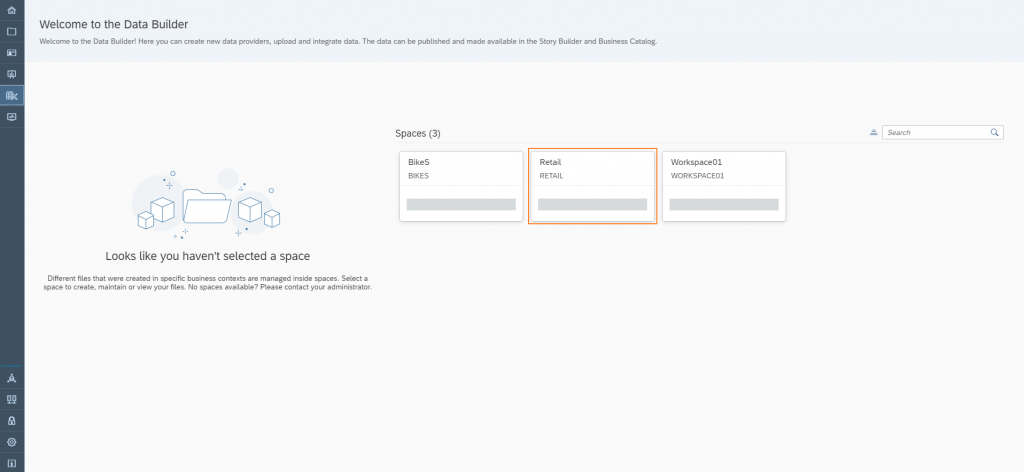
Select the space in which to continue working.
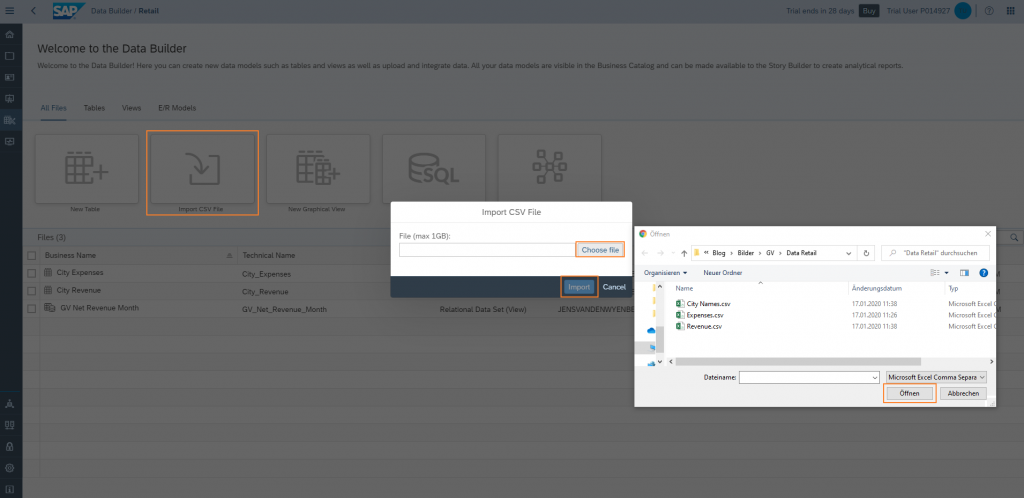
Here, the required CSV files can be easily imported into Datasphere. Tables are generated directly from the CSV files.
For the retail team's requirements, we need a consolidated view of our tables. A view must be created. It is possible to create the view definition using an SQL script or a graphical user interface; in this case, the graphical user interface is used.
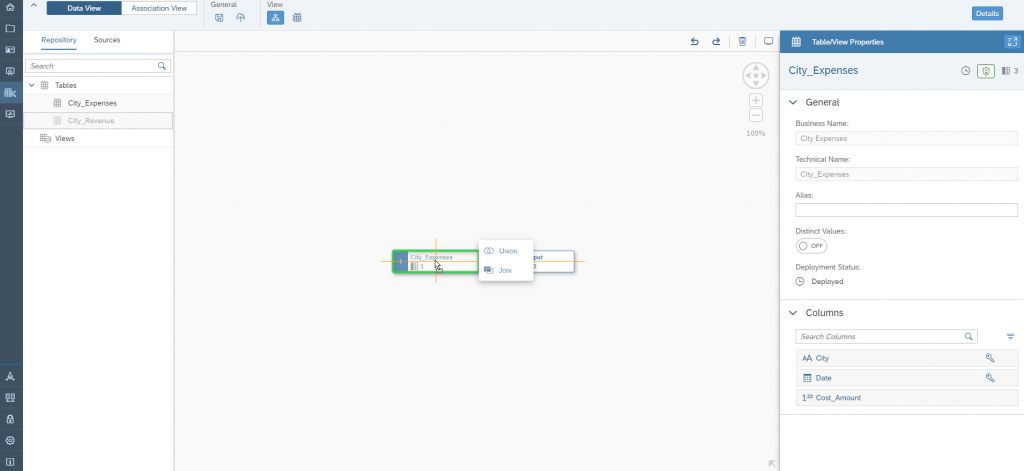
Select the "Sales" and "Costs" tables and simply add them to the view using drag and drop. A simple join of the tables is added.
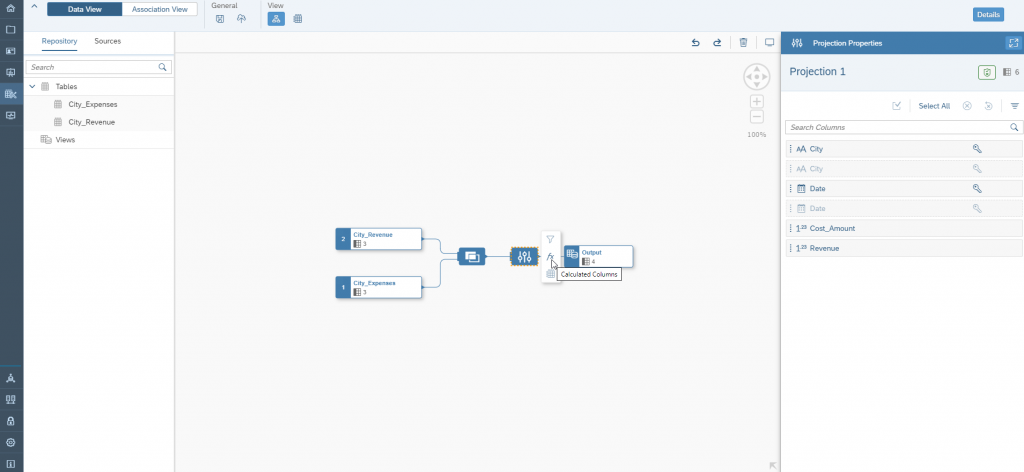
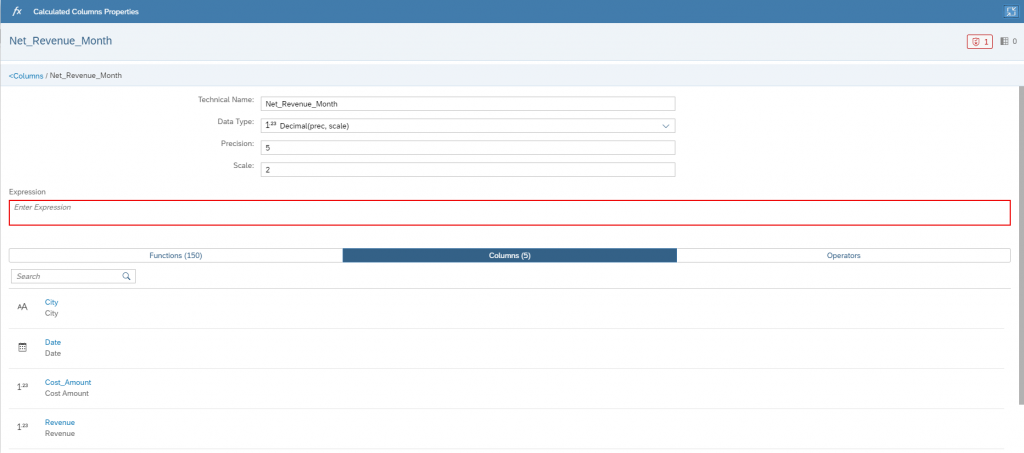
Since only sales and costs are currently available, we create a "calculated column" in which the profit per time period is calculated.
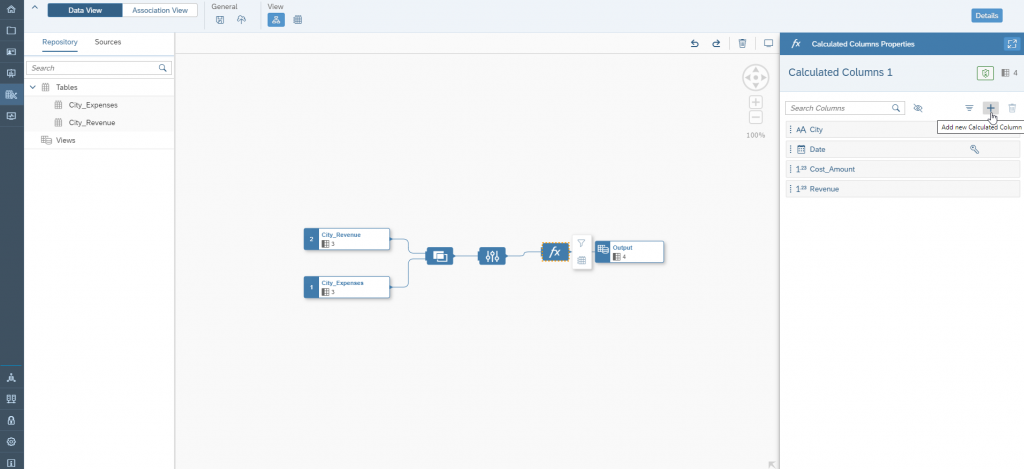
To do this, we first create the new column.
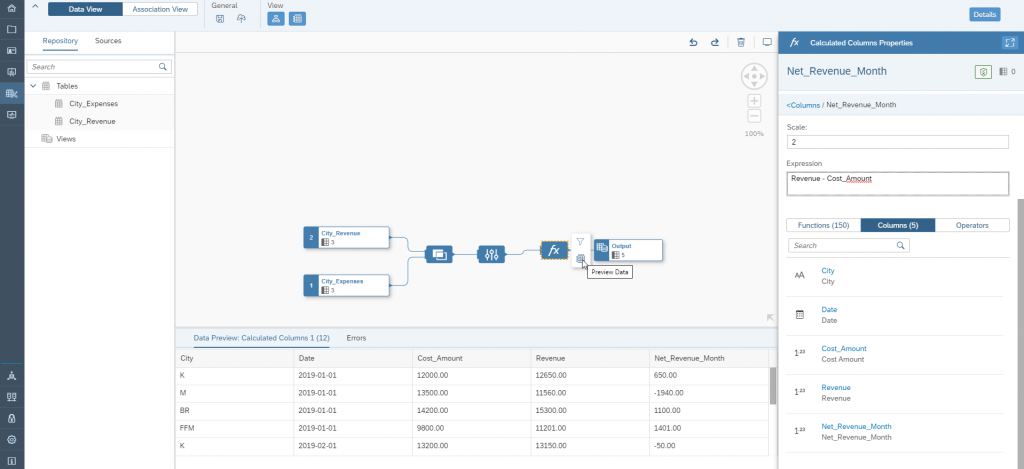
Add the fields and operators required for the calculations.
After completion, display the data for verification.
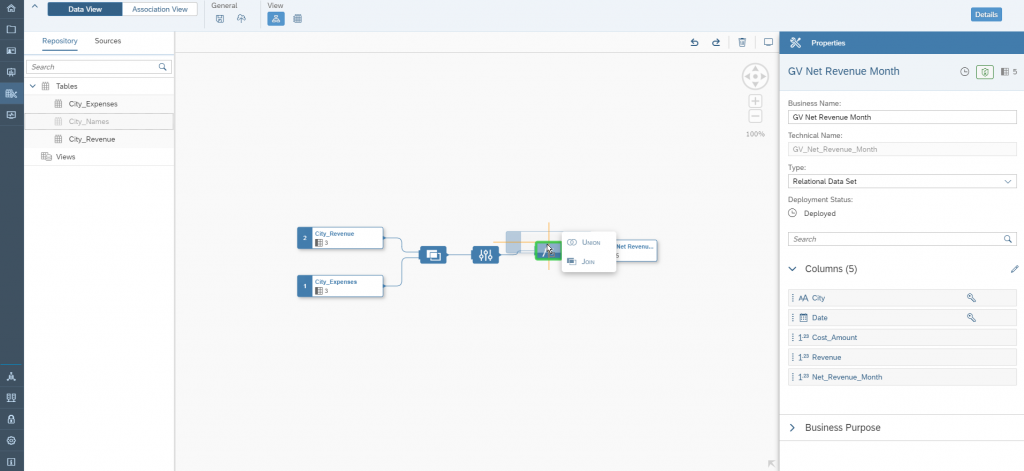
Since abbreviating city names in tables makes evaluation difficult, the retail team has created a CSV file in which the city names are stored alongside their abbreviations. Datasphere allows us to add any number of new tables to existing graphical views. In this case, the retail team adds the table with the city names to the view.
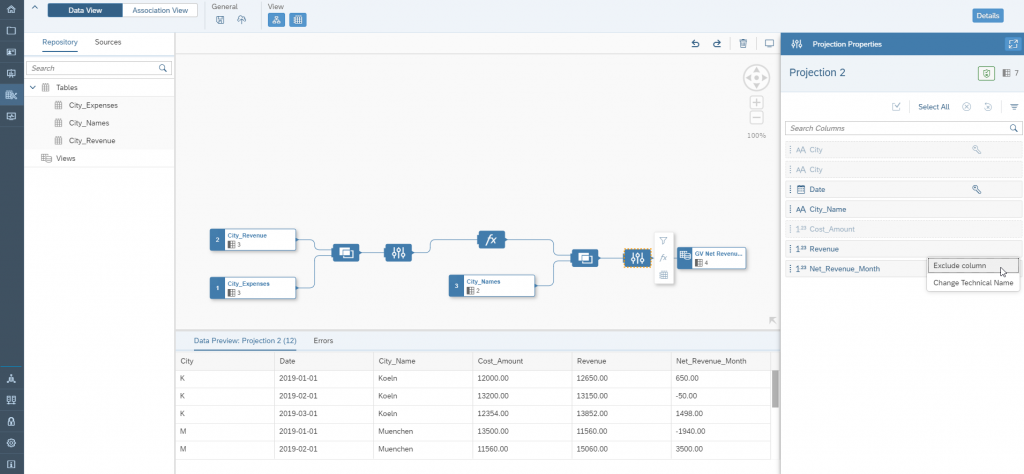
Columns that are not required for further evaluation can be hidden here if necessary.
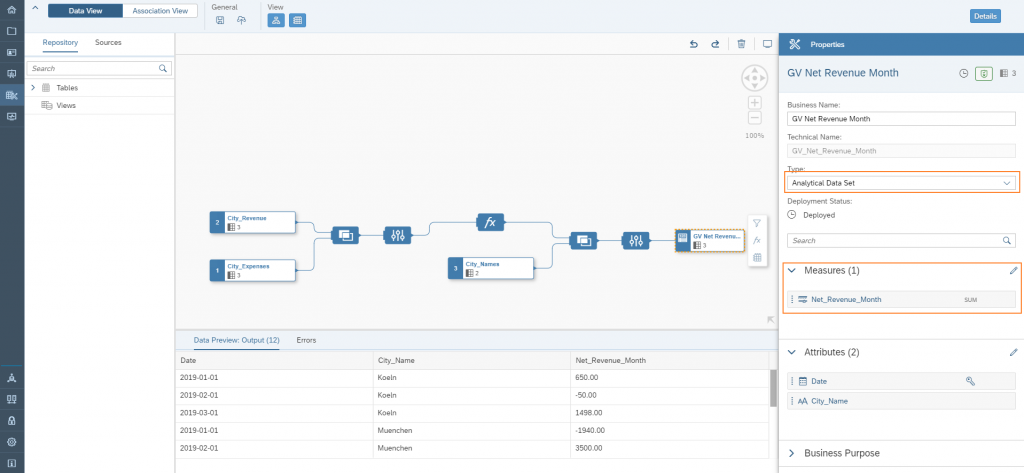
Please note: To use the graphical view in stories, it must be deployed as an analytical data set.
Voila. Our data model—admittedly a simple one—is now complete. This very straightforward example shows how easy and quick it is to build and expand simple data models.
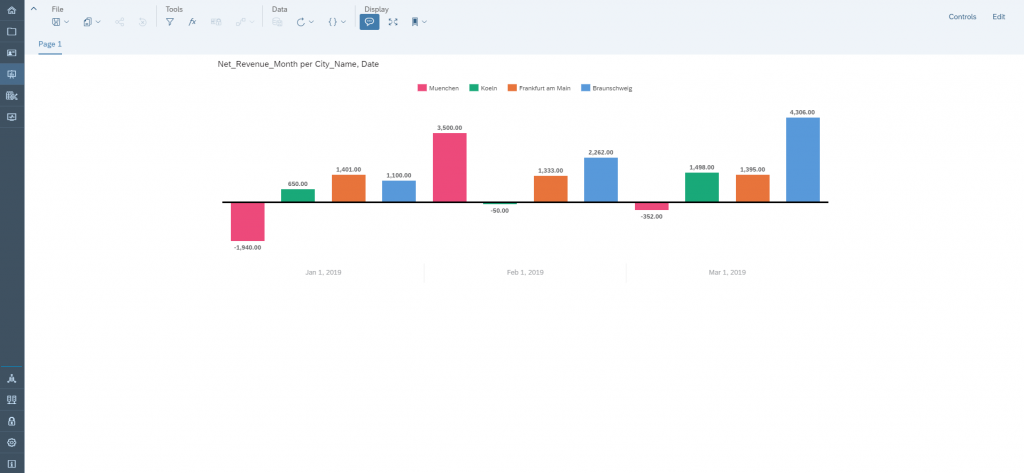
Visualization of data with Datasphere
A "light" version of SAP Analytics Cloud (SAC) is integrated into Datasphere. The SAC Story Builder is natively integrated into the Datasphere interface. This makes visualizing analytical data sets from Datasphere quick, easy, and convenient.
Since 1993, we have been operating as IT consultants for Data Analytics and Document Logistics, focusing on data management and process automation. We provide comprehensive support, from strategic IT consulting to specific implementations and solutions, all the way to IT operations, within the framework of holistic Enterprise Information Management (EIM). ISR is part of the CENIT EIM Group.