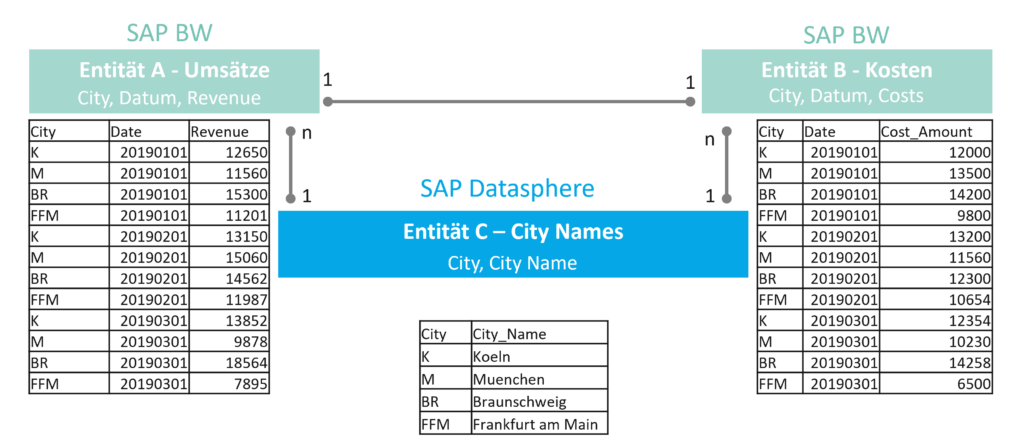
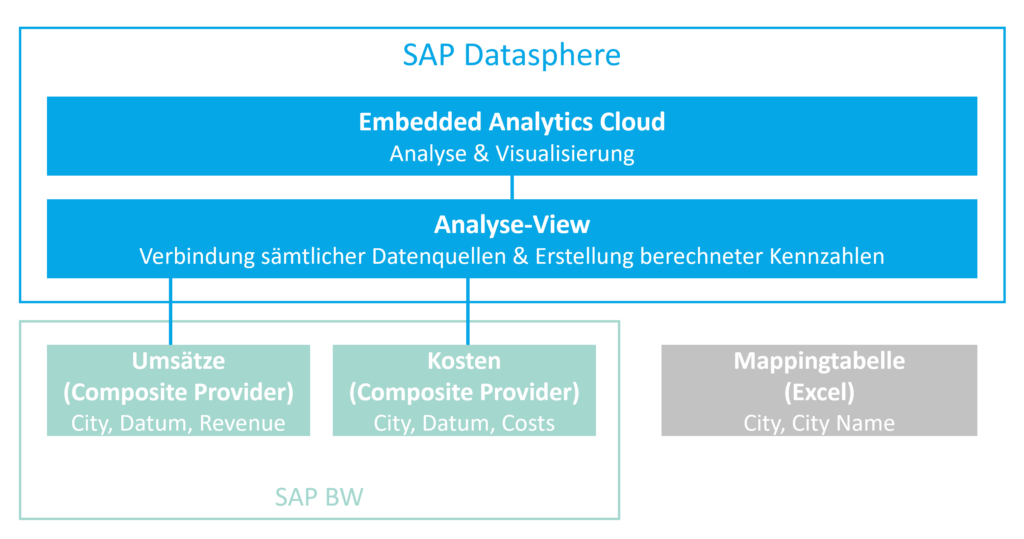
Our very simple example immediately demonstrates the strength of Datasphere. Modeling data models is very quick and easy. Datasphere is still very new on the market, but even today it already covers one use case very well:
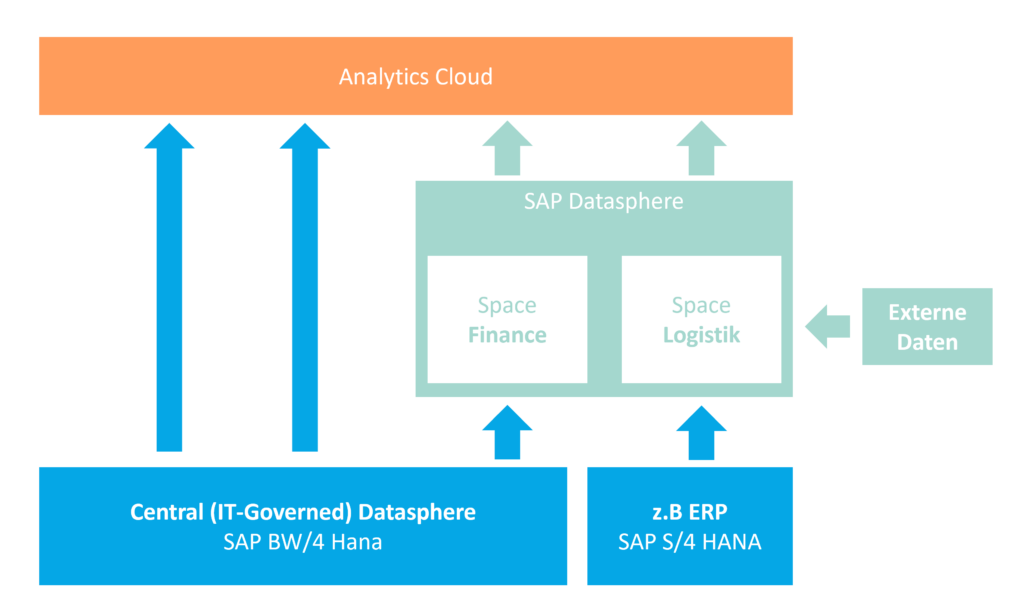
A company uses its SAP BW/4HANA system as a central enterprise data warehouse, placing a high value on governance and quality. However, the specialist departments are looking for a way to map flexible extensions and views based on this stable database. Datasphere is very well suited for this purpose. In our case, it was simply a matter of enriching a file. However, it is also conceivable to connect BW/4 data with information from other systems.