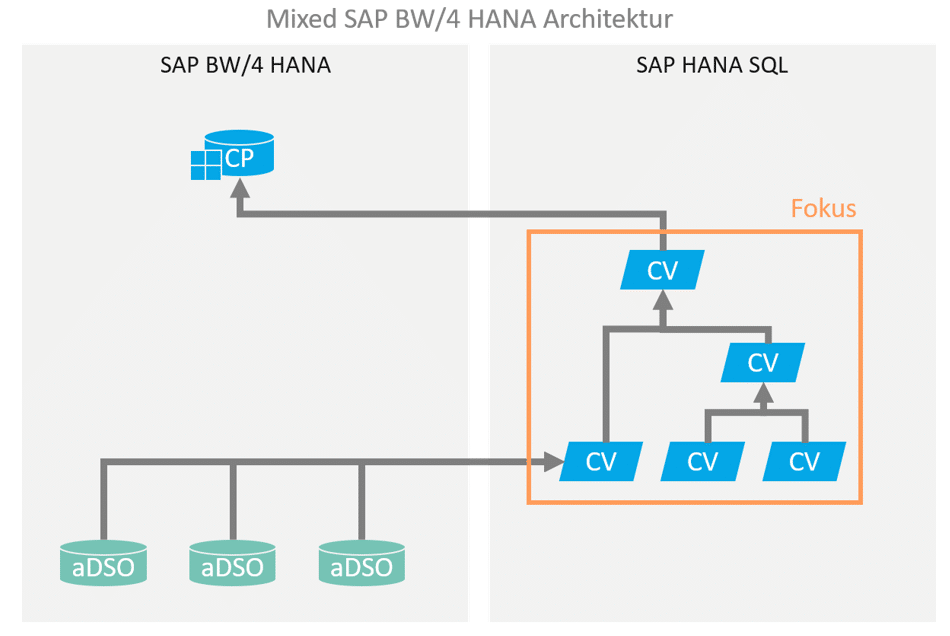
In the context of hybrid or mixed modeling for an SAP BW-based data warehouse, portions of the data modeling are executed using HANA SQL / native capabilities. This modeling is predominantly performed via HANA Calculation Views.
It is therefore very important to understand how HANA Calculation Views work in order to integrate them correctly into an SAP BW-driven data warehouse. Most SAP BW developers have many years of ABAP expertise. They are familiar with the development and debugging of ABAP programs. In hybrid data models, however, ABAP knowledge becomes less important when data flows are virtualized using Calculation Views. In this article, we would therefore like to provide some guidance on how to debug Calculation Views in Eclipse.
Debugging DataPreview
A graphical calculation view can map complex operations such as joining different tables, views, or even other calculation views. The central development elements of the calculation view are called nodes and are divided into JOIN, Union, Projection, Aggregation, and Rank nodes. Complex scenarios can quickly involve multiple nodes, reaching dimensions where structured error analysis becomes essential. To this end, in this blog post we will take a look at the options offered by DataPreview in HANA Studio for analyzing and debugging a calculation view.
Scenario
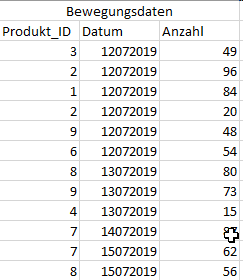
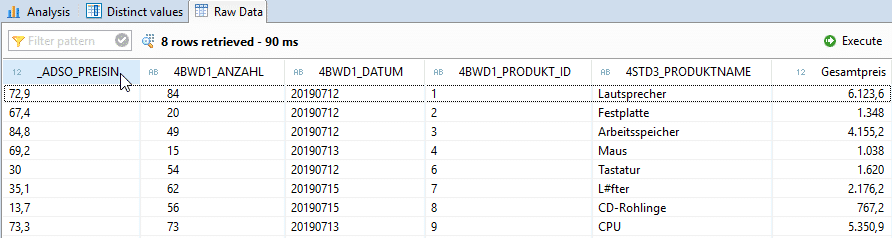
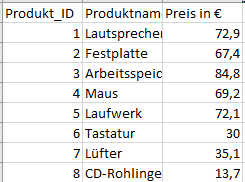
A classic example of a join in the SAP BW4/HANA environment is the enrichment of transaction data with master data. Let's take the sale of products on a specific date and the quantity sold as an example.
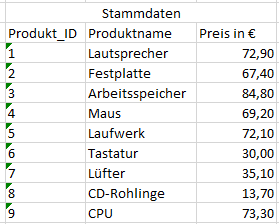
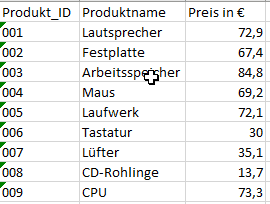
We expand this data set with the master data of the products, which includes the product descriptions and prices.
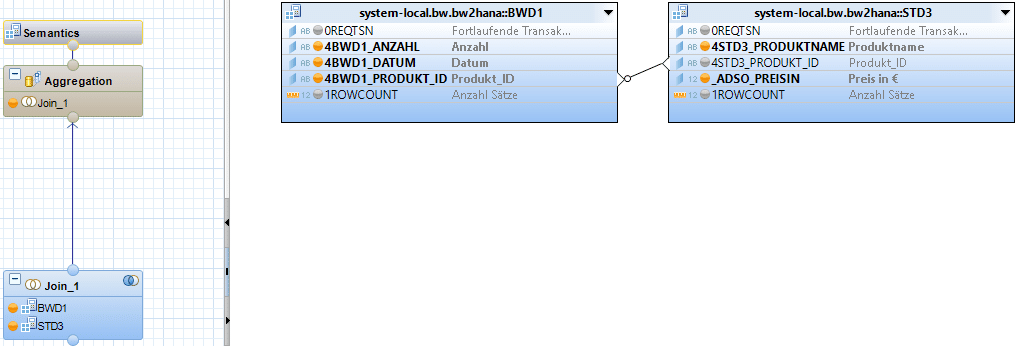
The implementation in a calculation view could look like this.
DataPreview
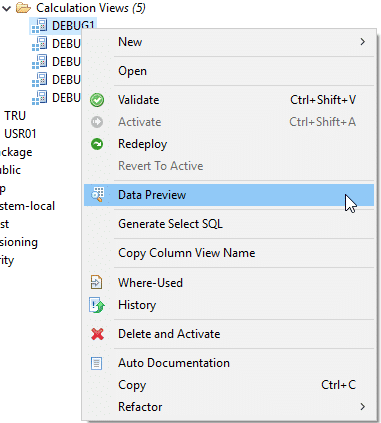
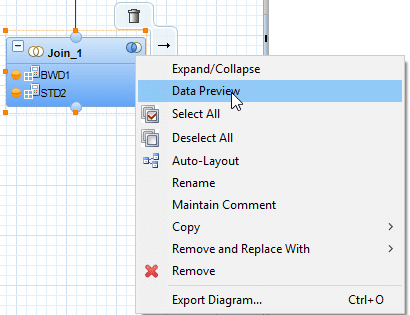
In general, Data Preview can be applied either to a Calculation View or directly to one of the underlying nodes (Aggregation, Projection, Rank, Join) or DataSource.
DataPreview provides developers with three different views of the data.
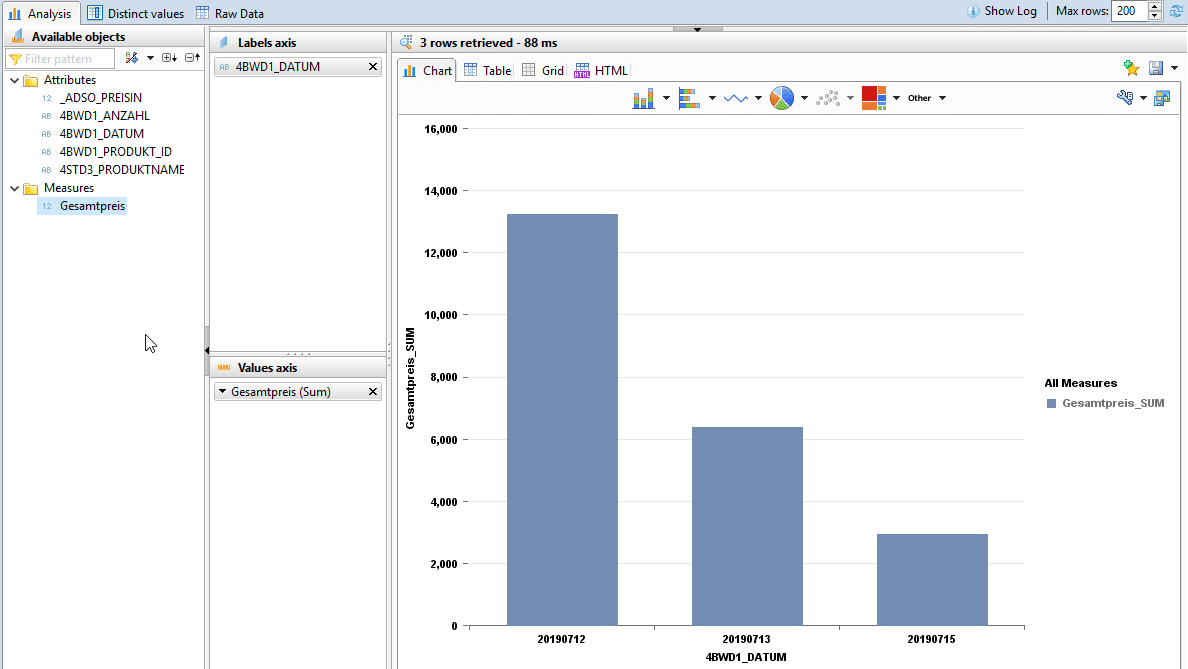
1) TheAnalysis viewcan be used to perform initial simple analyses and create graphical representations.
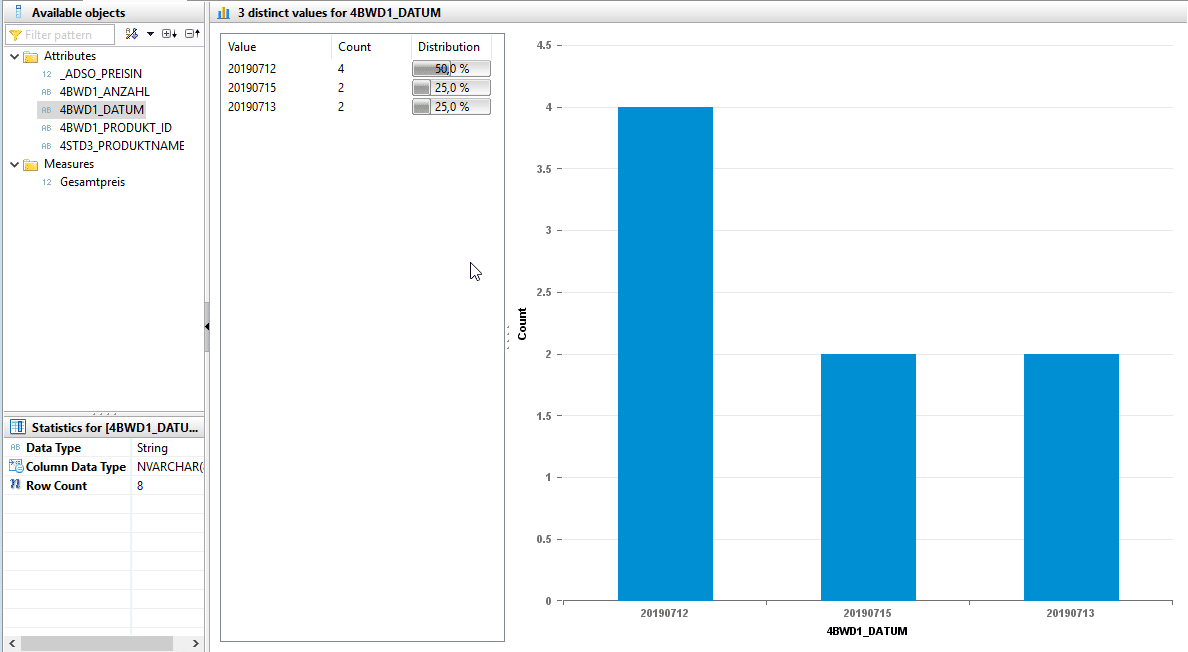
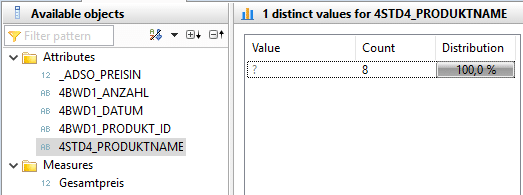
2) Thedistinct value viewprovides a view of the different values of an attribute.
3) Theraw data viewprovides an overview of the raw data.
Example test cases
To illustrate the possibilities of debugging using Data Preview, the following test cases were set up and customized incorrect data sets were provided.
1. Test successful JOIN (NULL test)
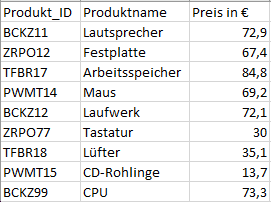
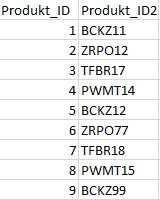
The data set contains product IDs that have a different data format than the product IDs in the transaction data.
The data set contains product IDs that have heterogeneous master data for the product IDs in the transaction data.
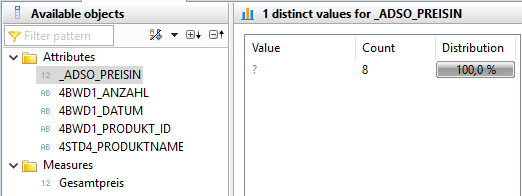
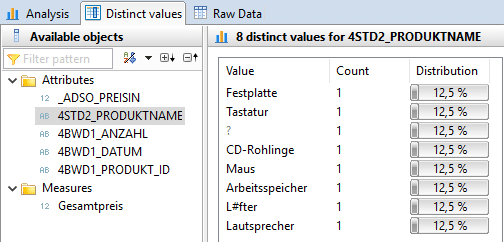
To test whether the JOIN with the master data of the products was successful, it is useful to view the distinct values of the product name.
It is apparent that the transaction data has not been enriched with the corresponding product names by the join. The price information is also missing. This is due to the heterogeneity of the product ID between the transaction data and master data sets. To change this situation, master data harmonization is required. In the case of different data formats, a data format adjustment is recommended. If the master data differs syntactically, a translation table is required to enable a join.
2. Test correct cardinality
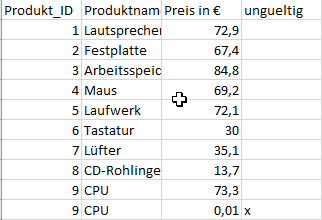
The dataset contains two records with the product ID 9.
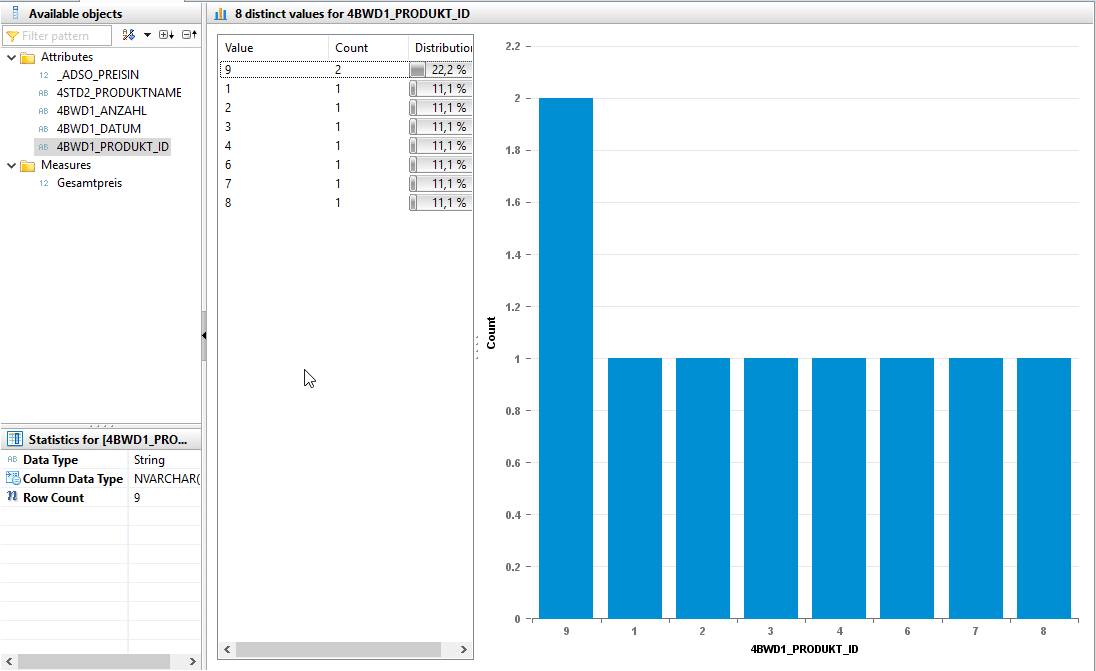
The cardinalities can also be examined using the Distinct Values view. When enriching with master data, we expect a cardinality of 1:1. However, the evaluation below shows that data duplication has occurred. Instead of the expected 8 product IDs (1-9), 9 data records are output due to the duplicate product ID 9. This is due to the second invalid product ID (9), which must be filtered out before the JOIN.
3. Test complete master data
The data record with product ID 9 is missing, unlike in the "original data set."
The Distinct Value view can also be used to test whether all product IDs are present in the master data set. It becomes apparent that the master data for product ID "9" is not present in the raw data and therefore needs to be added.
Analysis Calculation Views
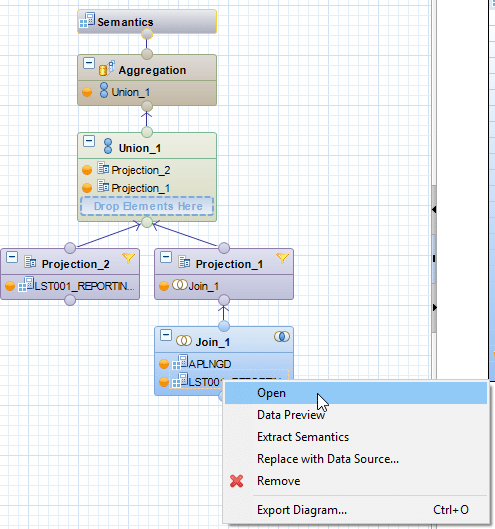
Calculation views are used to consume other analytics, attributes, and/or calculation views and column tables. This allows complex scenarios to be mapped in real business applications. To avoid "overloading" individual calculation views, it is possible to nest calculation views and thus encapsulate logic. However, the calculation view still offers the possibility of "looking" into the underlying or encapsulated calculation views.
In our example, this is the Reporting Hierarchy_View of an InfoObject.
Debugging debugger
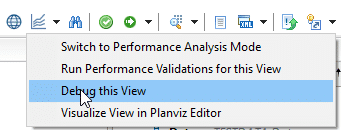
Calculation views can also be examined using a dedicated debugger. Once the calculation view has been activated, this can be opened via a somewhat hidden drop-down menu.
Further information
Using the debugging function requires some additional (HANA-side) authorizations, including the CATALOG READ and DATA ADMIN roles, as well as SELECT authorizations in the _SYS_REPO schema, since this is where the runtime objects of the calculation views are generated.
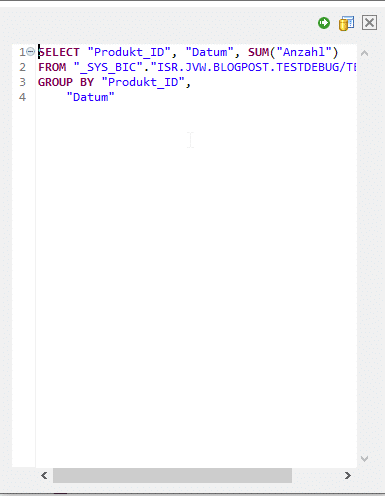
The debugger then automatically suggests a debugging query. This can either be accepted or customized according to your own preferences.
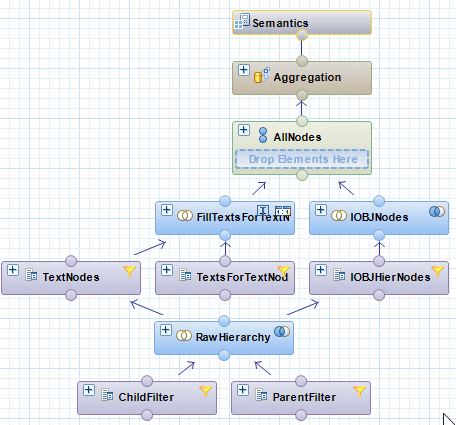
The Calculation View then opens in read-only mode.
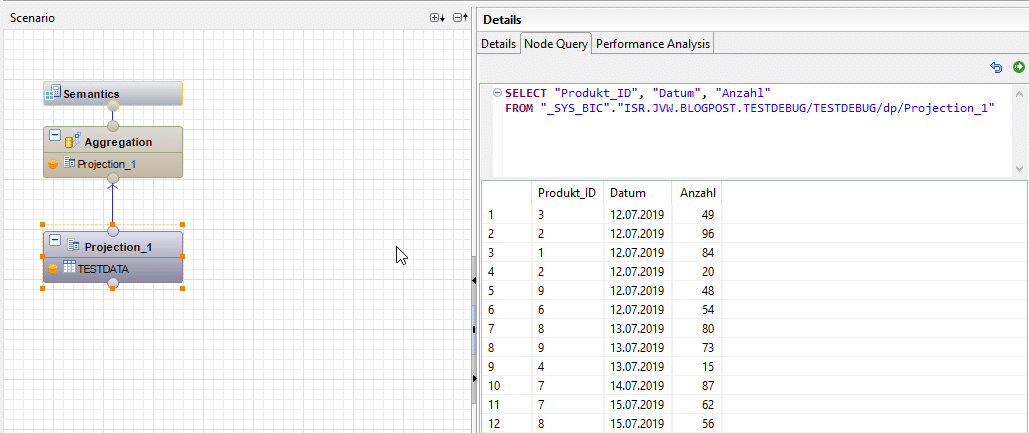
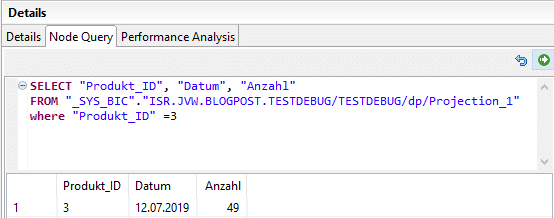
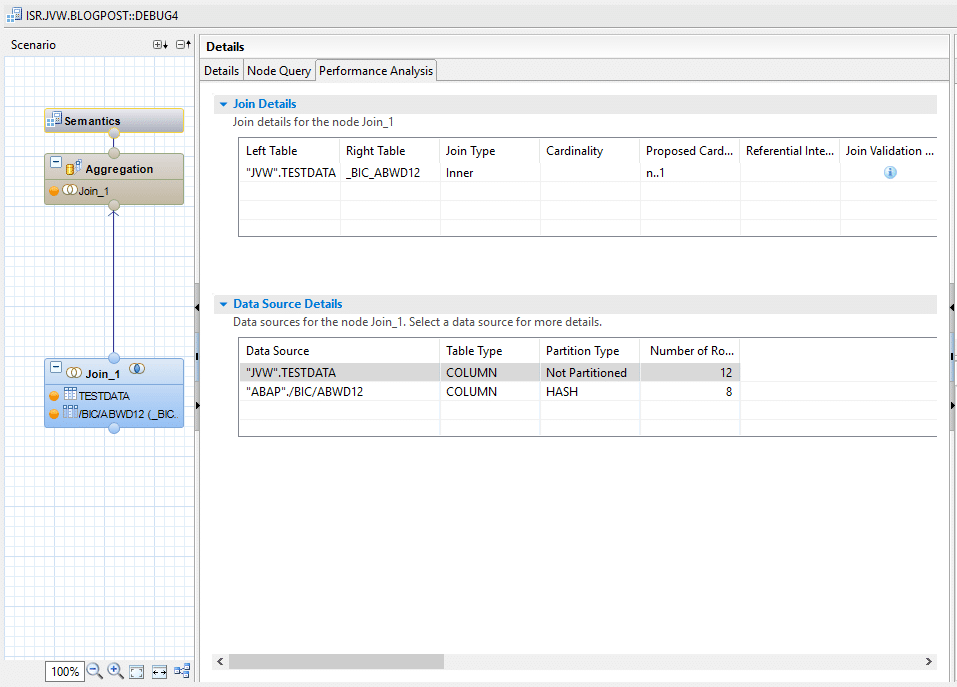
The main functionality of the debugger is to resolve each individual node into a corresponding SQL query. The query of the top node corresponds to our debugging query, which we defined in advance. In addition to the translated SQL query, the debugger provides us with a DataPreview of the result of each individual node. In contrast to the analysis with the DataPreview, this is not a static result. The debugger offers the option of adjusting the query on each individual node "on-the-fly," thereby influencing the result of each individual intermediate calculation.
In addition to the query information, the debugger provides a performance overview with basic information about the individual data sources and, if applicable, information about the join used. However, this information is only displayed for HANA tables.
Conclusion
This blog post has outlined two different technical options and approaches for debugging calculation views. Ultimately, it can be said that DataPreview and the debugger can be used to solve the same problems in different ways.
However, it is recommended to use the debugger in the early stages of developing a calculation view and to use DataPreview later on in the process. In the early stages of development, the debugger can clearly demonstrate its strength in flexible query modeling, whereas DataPreview would require the calculation view to be adjusted beforehand.
In later development phases, however, DataPreview can play to its strengths in data analysis, which the debugger does not offer.
Since 1993, we have been operating as IT consultants for Data Analytics and Document Logistics, focusing on data management and process automation. We provide comprehensive support, from strategic IT consulting to specific implementations and solutions, all the way to IT operations, within the framework of holistic Enterprise Information Management (EIM). ISR is part of the CENIT EIM Group.