Eine immer zentralere Rolle nehmen im Bereich Business Intelligence und Analytics die Frontend Tools ein. Sie richten sich heutzutage sowohl an Entwickler zur Erstellung komplexer Berichte und Anwendungen als auch mit teils umfangreichen Self-Service Lösungen an Endanwender.
Umfangreiche Tools vereinen die komplette Bandbreite von Datenakquise über Datenaufbereitung, bis hin zum individuell zugeschnittenen Bericht.
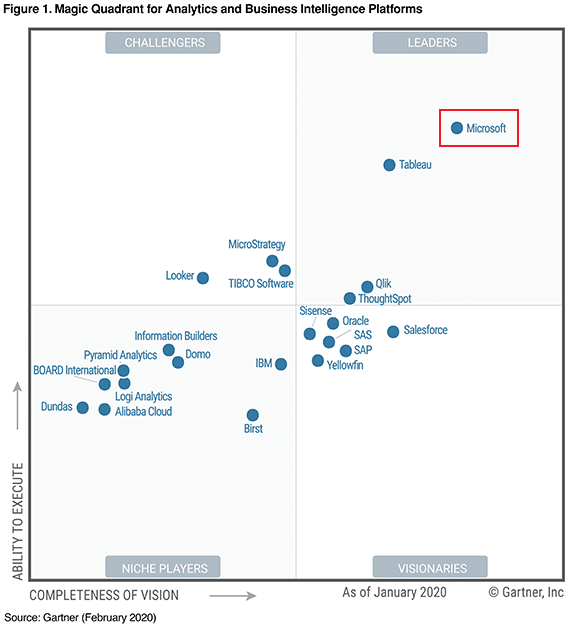
Das Unternehmen Gartner Inc. gibt regelmäßig Marktforschungsergebnisse und Analysen zur Entwicklung der IT heraus. Aus dem Bereich Business Intelligence Lösungen werden die auf dem Markt angebotenen Produkte nach Auswertung in verschiedene Kategorien eingeordnet. Allgemein gelten diese “Magic Quadrants” als zuverlässige Indikatoren in welche Richtung sich der Markt hin entwickelt.
Dieser Blog beschäftigt sich mit dem laut des “Gartner Magic Quadrant for Analytics and Business Intelligence Platforms” aus Februar 2020 führenden Tool in diesem Bereich, Microsoft Power BI. Dabei geht es hier weniger um das Tool selbst als vielmehr um die Integration zu SAP BW/4 HANA bzw. HANA.
Herstellung einer Verbindung
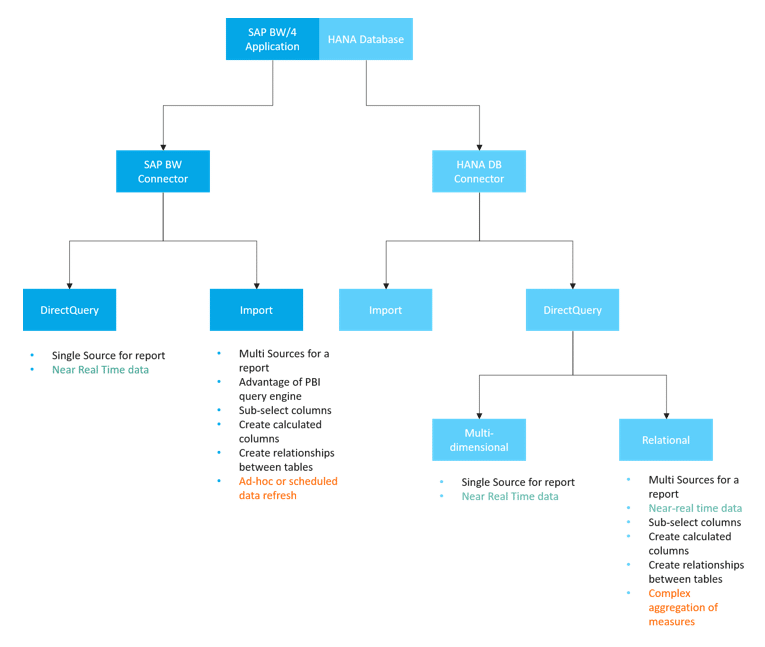
Power BI bietet zwei Konnektoren zu SAP Systemen an:
- SAP HANA Database Connector
- SAP Business Warehouse Application/Message Server Connector
Je nach Konnektor kommen unterschiedliche Abfragen in Betracht:
Bekannte “Besonderheiten” bei der Verbindung zu einem SAP HANA Data Warehouse
Bei der Verbindung von Power BI mit HANA gibt es einiges zu beachten. Nachfolgend haben wir ein paar Informationen zu diesen “Besonderheiten” zusammengestellt:
Probleme mit Features der SAP HANA DB
Verbindung zu SAP HANA DB (Datentypeinschränkungen)
Die folgende Sammlung von Problemen stammt von Microsoft: https://docs.microsoft.com/en-us/power-bi/connect-data/desktop-sap-hana.
| Datentyp | Einschränkung |
|---|---|
| NVARCHAR | Strings are truncated to a maximum length of 4000 Unicode characters. |
| SMALLDECIMAL | Not supported. |
| VARBINARY | Not supported. |
| Valid Dates | Between 1899/12/30 and 9999/12/31. |
Verbindung zu SAP HANA DB per DirectQuery (mehrdimensionale Quelle)
Modellierung
Die folgende Sammlung von Problemen stammt von Microsoft: https://docs.microsoft.com/en-us/power-bi/connect-data/desktop-directquery-sap-hana.
| Funktion | Beschreibung |
|---|---|
| No support for calculated columns | The ability to create calculated columns is disabled. This also means that Grouping and Clustering, which create calculated columns, are not available. |
| Additional limitations for measures | There are additional limitations imposed on the DAX expressions that can be used in measures, to reflect the level of support offered by SAP HANA. |
| No support for defining relationships | Only a single view can be queried within a report, and as such, there's no support for defining relationships. |
| No Data View | Normally displays the detail level data in the tables. Given the nature of OLAP sources such as SAP HANA, this view is not available over SAP HANA. |
| Column and measure details are fixed | The list of columns and measures seen in the field list are fixed by the underlying source, and cannot be modified. For example, it's not possible to delete a column, nor change its datatype (it can, however, be renamed). |
| Additional limitations in DAX | There are additional limitations on the DAX that can be used in measure definitions, to reflect limitations in the source. For example, it's not possible to use an aggregate function over a table. |
Visualisierung
| Funktion | Beschreibung |
|---|---|
| No aggregation of columns | It's not possible to change the aggregation for a column on a visual, and it is always Do Not Summarize. |
Bekannte Probleme
| Funktion | Beschreibung |
|---|---|
| SAP HANA issue when query for Counters, and other measures | Incorrect data is returned from SAP HANA if connecting to an Analytical View, and a Counter measure and some other ratio measure, are included in the same visual. This is covered by SAP Note 2128928 (Unexpected results when query a Calculated Column and a Counter). The ratio measure will be incorrect in this case. |
| Multiple Power BI columns from single SAP HANA column | For some calculation views, where a SAP HANA column is used in more than one hierarchy, SAP HANA exposes this as two separate attributes. This results in two columns being created in Power BI. Those columns are hidden by default, however, and all queries involving the hierarchies, or the columns directly, behave correctly. |
Allgemeine Einschränkungen oder SAP HANA Funktionen, welche sich anders verhalten
| Funktion | Beschreibung |
|---|---|
| Parent Child Hierarchies | Parent child hierarchies will not be visible in Power BI. This is because Power BI accesses SAP HANA using the SQL interface, and parent child hierarchies cannot be fully accessed via SQL. |
| Other hierarchy metadata | The basic structure of hierarchies is displayed in Power BI, however some hierarchy metadata (such as controlling the behavior of ragged hierarchies) will have no effect. Again, this is due to the limitations imposed by the SQL interface. |
| Connection using SSL | You can connect using Import and multi-dimensional with SSL, buy cannot connect to SAP HANA instances configured to use SSL for the relational connector. |
| Support for Attribute views | Power BI can connect to Analytic and Calculation views, but cannot connect directly to Attribute views. |
| Support for Catalog objects | Power BI cannot connect to Catalog objects. |
| Change to Variables after publish | You cannot change the values for any SAP HANA variables directly in the Power BI service, after the report is published. |
Probleme mit Features des SAP BW
Verbindung zu SAP BW per DirectQuery (mehrdimensionale Quelle)
Die folgende Sammlung von Problemen stammt von Microsoft: https://docs.microsoft.com/en-us/power-bi/connect-data/desktop-directquery-sap-bw.
Modellierung
Gleiche Einschränkungen wie für Verbindungen zu SAP HANA DB per DirectQuery.
Visualisierung
| Funktion | Beschreibung |
|---|---|
| No aggregation of columns | It is not possible to change the aggregation for a column on a visual; it is always Do Not Summarize |
| Measure filtering is disabled | Measure filtering is disabled to reflect the support offered by SAP BW. |
| Multi-select and include/exclude | The ability to multi-select data points on a visual is disabled if the points represent values from more than one column. For example, given a bar chart showing Sales by Country, with Category on the Legend, it would not be possible to select the point for (USA, Bikes) and (France, Clothes). Similarly, it would not be possible to select the point for (USA, Bikes) and exclude it from the visual. Both limitations are imposed to reflect the support offered by SAP BW. |
Allgemeine Einschränkungen oder SAP BW Funktionen welche sich anders verhalten
| Funktion | Beschreibung |
|---|---|
| Local calculations | Local calculations defined in a BEx Query will change the numbers as displayed through tools like BEx Analyzer. However, they are not reflected in the numbers returned from SAP, through the public MDX interface. As such, the numbers seen in a Power BI visual will not necessarily match those for a corresponding visual in an SAP tool. For example, when connecting to a query cube from a BEx query that sets the aggregation to be Cumulated (i.e. running sum), Power BI would get back the base numbers, ignoring that setting. An analyst could certainly then apply a running sum calculation locally in Power BI, but would need to exercise caution in how the numbers are interpreted if this is not done. |
| Aggregations | In some cases (particularly when dealing with multiple currencies), the aggregate numbers returned by the SAP public interface do not match those shown by SAP tools. As such, the numbers seen in a Power BI visual will not necessarily match those for a corresponding visual in an SAP tool. For example, totals over different currencies would show as "*" in BEx Analyzer, but the total would get returned by the SAP public interface, without any information that such an aggregate number is meaningless. Thus the number (aggregating, say, $, EUR, and AUD) would get displayed by Power BI. |
| Currency formatting | Any currency formatting (for example, $2,300 or 4000 AUD) is not reflected in Power BI. |
| Units of measure | Units of measure (for example, 230 KG) are not reflected in Power BI. |
| Key versus text (short, medium, long) | For an SAP BW characteristic like CostCenter, the field list will show a single column Cost Center. Using that column will display the default text. By showing hidden fields, it will also be possible to see the unique name column (that returns the unique name assigned by SAP BW, and is the basis of uniqueness). The key and other text fields are not available. |
| Additional limitations in DAX | There are additional limitations on the DAX that can be used in measure definitions, to reflect limitations in the source. For example, it's not possible to use an aggregate function over a table. |
| Multiple hierarchies of a characteristic |
In SAP: A characteristic can have multiple hierarchies. Then in tools like BEx Analyzer, when a characteristic is included in a query, the user can select the hierarchy to use. In Power BI: The various hierarchies can be seen in the field list as different hierarchies on the same dimension. However, selecting multiple levels from two different hierarchies on the same dimension will result in empty data being returned by SAP. |
| Treatment of ragged hierarchies | |
| Scaling factor/reverse sign | In SAP, a key figure can have a scaling factor (for example, 1000) defined as a formatting option, meaning that all display will be scaled by that factor. It can similarly have a property set that reverses the sign. Use of such a key figure in Power BI (in a visual, or as part of a calculation) will result in the unscaled number being used (and the sign is not reversed). The underlying scaling factor is not available. In Power BI visuals, the scale units shown on the axis (K,M,B) can be controlled as part of the visual formatting. |
| Hierarchies where levels appear/disappear dynamically | Initially when connecting to SAP BW, the information on the levels of a hierarchy will be retrieved, resulting in a set of fields in the field list. This is cached, and if the set of levels changes, then the set of fields do not change until Refresh is invoked. This is only possible in Power BI Desktop. Such Refresh to reflect changes to the levels cannot be invoked in the Power BI service after Publish. |
| Default filter | A BEx query can include Default Filters, which will be applied automatically by SAP BEx Analyzer. These are not exposed, and hence the equivalent usage in Power BI will not apply the same filters by default. |
| Hidden Key figures | A BEx query can control visibility of Key Figures, and those that are hidden will not appear in SAP BEx Analyzer. This is not reflected through the public API, and hence such hidden key figures will still appear in the field list. However, they can then be hidden within Power BI. |
| Numeric formatting | Any numeric formatting (number of decimal positions, decimal point, etc.) will not automatically be reflected in Power BI. However, it is possible to then control such formatting within Power BI. |
| Hierarchy versioning | SAP BW allows different versions of a hierarchy to be maintained, for example, the cost center hierarchy in 2007 versus 2008. Only the latest version will be available in Power BI, as information on versions is not exposed by the public API. |
| Time dependent hierarchies | When using Power BI, time dependent hierarchies are evaluated at the current date. |
| Currency conversion | SAP BW supports currency conversion, based on rates held in the cube. Such capabilities are not exposed by the public API, and are therefore not available in Power BI. |
| Sort Order | The sort order (by Text, or by Key) for a characteristic can be defined in SAP. This sort order is not reflected in Power BI. For example, months might appear as “April”, “Aug”, and so on. It is not possible to change this sort order in Power BI. |
| Technical names | In Get Data, the characteristic/measure names (descriptions) and technical names can both be seen. The field list will contain just the characteristic/measure names (descriptions). |
| Attributes | It is not possible to access the attributes of a characteristic within Power BI. |
| End user language setting | The locale used to connect to SAP BW is set as part of the connection details, and does not reflect the locale of the final report consumer. |
| Text Variables | SAP BW allows field names to contain placeholders for variables (for example, "$YEAR$ Actuals") that would then get replaced by the selected value. For example, the field appears as "2016 Actuals" in BEx tools, if the year 2016 were selected for the variable. The column name in Power BI will not be changed depending on the variable value, and therefore would appear as "$YEAR$ Actuals". However, the column name can then be changed in Power BI. |
| Customer Exit Variables | Customer Exit variables are not exposed by the public API, and are therefore not supported by Power BI. |
| Characteristic Structures | Any Characteristic structures in the underlying SAP BW source will result in an ‘explosion’ of measures being exposed in Power BI. For example, with two measures Sales and Costs, and a characteristic structure containing Budget and Actual, four measures will be exposed: Sales.Budget, Sales.Actual, Costs.Budget, Costs.Actual. |
Fazit
Microsoft’s Power BI stellt ein mächtiges BI-Tool, zur Datenaufbereitung bzw. Datenvisualisierung dar, welches sich durch die einfach gehaltene Oberfläche insbesondere auch an Endbenutzer richtet. Neben diversen anderen Quellen, können auch Daten aus einem SAP BW konsumiert werden. Die Einschränkungen von BW- / HANA DB-Funktionalitäten betreffen verschiedenste Bereiche und können je nachdem wie ein System aufgebaut ist zu erheblichen Problemen führen. So werden beispielsweise “Customer Exit Variables” seitens Power BI nicht unterstützt. Diese werden jedoch häufig für Hintergrundlogiken genutzt, welche Queryergebnisse an individuelle Eingaben anpassen sollen. Solche Logiken müssten ggf. anders implementiert werden. Auch gibt es einige Limitationen bezüglich der Modellierungs- sowie Visualisierungsmöglichkeiten. Diese sind zum Teil durch die benutzte Schnittstelle (MDX) begründet, welche zum Beispiel in der Query lokal berechnete Werte nicht weitergibt.
Dieser Blogeintrag soll keine Bewertung von Power BI selbst sein. Vielmehr geht es um die Herausstellung von Besonderheiten der Anbindung von Power BI um diese bei dem Architektur-Design zu berücksichtigen.

Christopher Kampmann
Head of Business Unit
Data & Analytics
christopher.kampmann@isr.de
+49 (0) 151 422 05 448